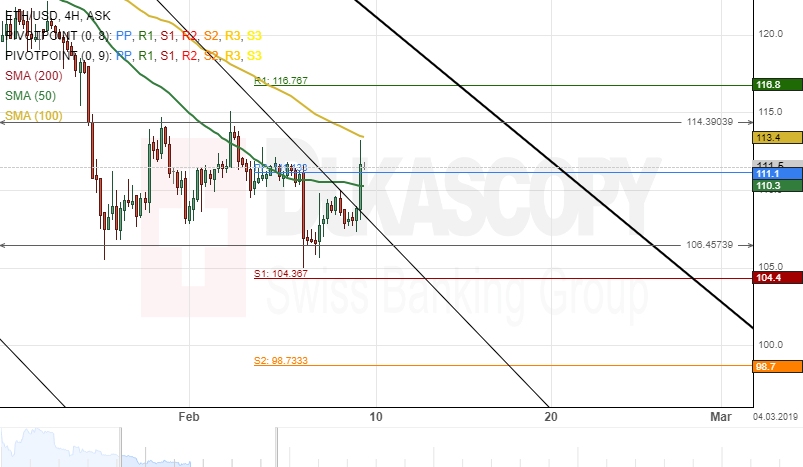
The Ethereum cryptocurrency has been trading between the upper and lower boundaries of a horizontal channel for the past week. The 50-hour simple moving average was providing resistance for the pair at 110.3 during the previous trading sessions.
Everything being equal, it is likely that the 50-hour SMA could push the cryptocurrency towards a support level at 104.36.
However, given that the ETH/USD pair is located near the upper boundary of a descending channel pattern, a breakout could be expected within this session.