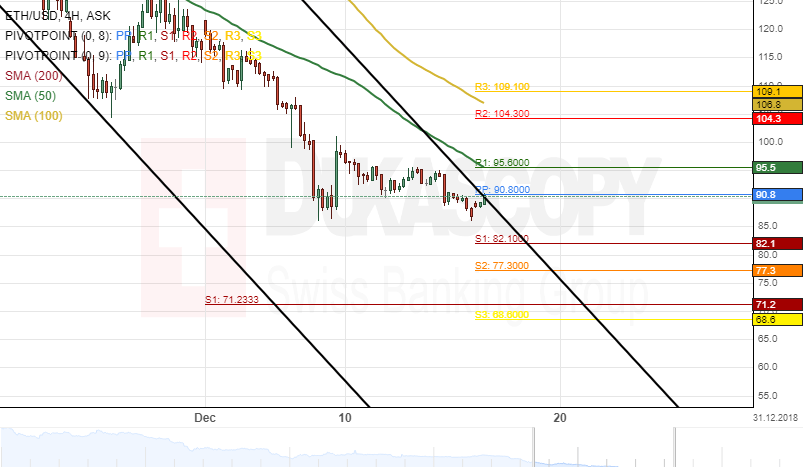
The ETH/USD pair has been trading in a medium-term descending channel pattern since the beginning of November.
The Ethereum cryptocurrency was trading near the upper boundary of the medium-term channel at 90.80 during the morning hours of Monday’s session and could be set for a breakout.
If this breakout occurs, the blockchain will aim at a resistance level formed by the 100-hour simple moving average at 108.8.
However, technical indicators demonstrate that the surge might not be immediate.