A note on lower timeframe confirming price action…
Waiting for lower timeframe confirmation is our main tool to confirm strength within higher timeframe zones, and has really been the key to our trading success. It takes a little time to understand the subtle nuances, however, as each trade is never the same, but once you master the rhythm so to speak, you will be saved from countless unnecessary losing trades. The following is a list of what we look for:
- A break/retest of supply or demand dependent on which way you’re trading.
- A trendline break/retest.
- Buying/selling tails … essentially we look for a cluster of very obvious spikes off of lower timeframe support and resistance levels within the higher timeframe zone.
- Candlestick patterns. We tend to only stick with pin bars and engulfing bars as these have proven to be the most effective.
We typically search for lower-timeframe confirmation between the M15 and H1 timeframes, since most of our higher-timeframe areas begin with the H4. Stops are usually placed 1-3 pips beyond confirming structures.
EUR/USD
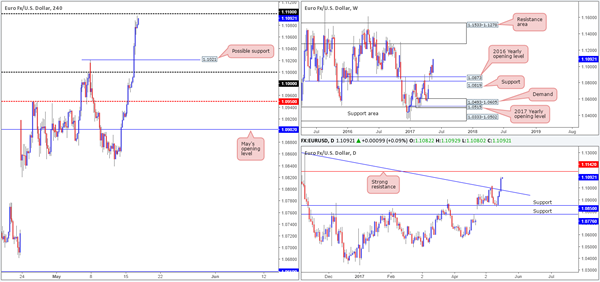
The value of the EUR strengthened in aggressive fashion on Tuesday, as the US dollar continued to plummet. Several H4 tech resistances were wiped out during the assault, with key resistance now resting around the 1.11 handle.
Alongside this, daily action ran through a trendline resistance extended from the high 1.1616, and is now seen within striking distance of a strong resistance line coming in at 1.1142. This barrier stretches as far back as early 2015, so it’s certainly not a level one should overlook. Looking up to the weekly candles, however, the bulls appear to have a relatively clear run up to a resistance area drawn from 1.1533-1.1278.
Our suggestions: Upside momentum has unquestionably diminished ahead of the 1.11 hurdle, but is this enough to consider shorting? Given the strength of the bulls over the past few days, we would be wary of selling from here. What’s more, let’s take into account that forty or so pips above 1.11 sits a formidable daily resistance line at 1.1142, which is likely being watched by the majority of the market.
At the time of writing, our idea is to wait and see how the market reacts once it connects with the said daily resistance, as this could be a critical turning point, and one that we may consider shorting should a reasonably sized H4 bearish candle form
Data points to consider: No high-impacting news on the docket today.
Levels to watch/live orders:
- Buys: Flat (stop loss: N/A).
- Sells: 1.1142 region ([waiting for a reasonably sized H4 bear candle, preferably a full-bodied candle, to form before pulling the trigger is advised] stop loss: ideally beyond the candle’s wick).
GBP/USD
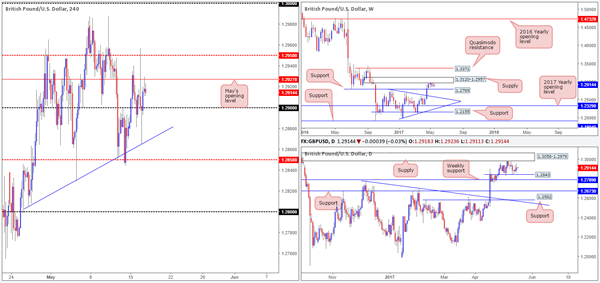
Overall, yesterday’s UK inflation figures came in better than expected. Despite this, the pair failed to sustain gains beyond the H4 mid-level resistance at 1.2950 and tumbled to a low of 1.2865, bouncing nicely off of a H4 trendline support taken from the low 1.2804.With the H4 candles currently responding to the underside of May’s opening level at 1.2927, we could be looking at another test of the 1.29 handle today, or even possibly the trendline support again.
The bigger picture shows weekly price to be trading around the underside of a supply base at 1.3120-1.2957, which eventually could force the unit to retest support at 1.2789. Meanwhile, daily flow is seen loitering mid-range between support at 1.2843 and supply penciled in at 1.3058-1.2979.
Our suggestions: Neither a long nor short seems attractive at the moment.
In view of how close the 1.29 handle is and the aforementioned H4 trendline support, this is not really a market we want to be shorting today. In regards to longs from 1.29, we would also steer clear. Pressure from weekly sellers, coupled with May’s opening level lurking above, followed closely by 1.2950, is enough to suggest that buying may not be a good path to take.
Data points to consider: UK employment figures at 9.30am GMT+1.
Levels to watch/live orders:
- Buys: Flat (stop loss: N/A).
- Sells: Flat (stop loss: N/A).
AUD/USD
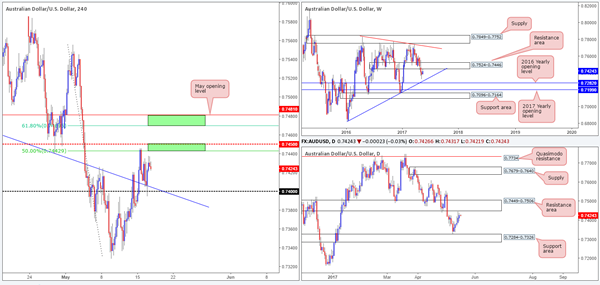
In the early hours of yesterday’s segment, the RBA released its latest meeting minutes. The bank highlighted concern regarding the housing market bubble which in turn saw the Aussie decline in value, eventually bringing the unit down to the 0.74 handle which happens to merge with a H4 trendline support etched from the low 0.7475. The bounce from this number was solid and helped the pair record its fifth consecutive daily gain! While this is considered a bullish cue on this scale, it’s advised to remain cognizant of the overall picture here. The weekly timeframe shows price recently touched base with the underside of a resistance area at 0.7524-0.7446, which has been in motion since mid-2016. In addition to this, the daily timeframe also reveals that price came within touching distance of a resistance area at 0.7449-0.7506.
Our suggestions: With the bigger picture in mind, our team has absolutely no interest in buying this market today. In fact, we’re more drawn to shorts at the moment and have two areas of interest in focus:
The H4 mid-level hurdle at 0.7450/50.0% retracement at 0.7442. This small area represents the underside of both the aforementioned daily and weekly resistance areas.
May’s opening level at 0.7481/H4 61.8% Fib resistance at 0.7470. This zone is actually planted within the above said higher-timeframe areas.
To take advantage of these barriers, we would strongly recommend patiently waiting for price action to confirm seller interest beforehand. Waiting for a reasonably sized H4 bearish candle to form, preferably a full-bodied candle, would be ideal.
Data points to consider: No high-impacting news on the docket today.
Levels to watch/live orders:
- Buys: Flat (stop loss: N/A).
- Sells: 0.7450/0.7442 ([waiting for a reasonably sized H4 bear candle, preferably a full-bodied candle, to form before pulling the trigger is advised] stop loss: ideally beyond the candle’s wick). 0.7481/0.7470 ([waiting for a reasonably sized H4 bear candle, preferably a full-bodied candle, to form before pulling the trigger is advised] stop loss: ideally beyond the candle’s wick).
USD/JPY
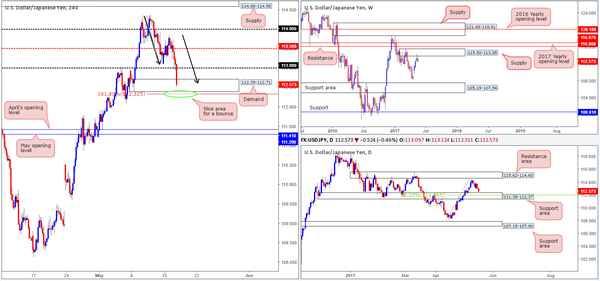
Beginning with a look at the weekly timeframe this morning, it’s clear that the bears are beginning to make an appearance around supply at 115.50-113.85. Should this area hold firm, the next downside target, apart from the weekly low of 108.13, is the support area coming in at 105.19-107.54. Daily price on the other hand, shows us that the unit is trading within touching distance of a support area at 111.35-112.37, which happens to hold a 38.2% Fib support at 111.96 marked from the low 108.13.
Over on the H4 chart, we can see price recently breached the 113 handle and is now seen testing the H4 demand base coming in at 112.39-112.71. What’s also notable from a technical perspective is the 1:1 correction (black arrows) and the 161.8% Fib ext. at 112.32 taken from the high 114.36.
Our suggestions: Although weekly action is currently trading from supply right now, there’s still a reasonable chance that price will bounce from the daily support area. The above noted 161.8% H4 Fib ext. is attractive for longs due to it sitting within the daily support base. Entering long using a pending order here, however, would be chancy given the weekly picture. For this reason, we’re going to sit on our hands and patiently wait for additional confirmation in the form of a reasonably sized H4 bullish candle (preferably a full-bodied candle) before pulling the trigger.
Data points to consider: No high-impacting news on the docket today.
Levels to watch/live orders:
- Buys: 112.32 region ([waiting for a reasonably sized H4 bull candle, preferably a full-bodied candle, to form before pulling the trigger is advised] stop loss: ideally beyond the candle’s tail).
- Sells: Flat (stop loss: N/A).
USD/CAD
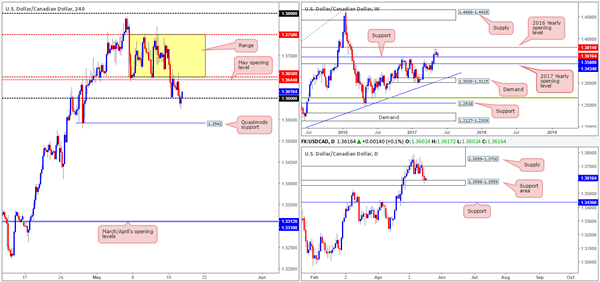
In recent sessions, the USD/CAD connected with not only a weekly support level at 1.3588, but also a daily support area drawn from 1.3598-1.3559. For those who read Tuesday’s report you may recall that our team mentioned to watch for a possible whipsaw through the 1.36 number for a possible long, which, as you can see, happened not too long ago!
Nevertheless, it looks like we’ve missed the boat on this one unfortunately. Well done to any of our readers who managed to jump aboard here, as its likely H4 price will look to trade back into the range fixed between 1.3750/1.3650.
Our suggestions: We’re slightly upset that we missed this entry, but all may not be lost here. The next best option we have is waiting for a decisive H4 close above 1.3650. Should this come to fruition and follow up with a retest of this number and a reasonably sized H4 bull candle, preferably a full-bodied candle, we’d look to long this market, targeting the upper edge of the H4 consolidation.
Data points to consider: Canadian Manufacturing sales at 1.30pm and US Crude Oil inventories at 3.30pm GMT+1
Levels to watch/live orders:
- Buys: Watch for a H4 close above 1.3650 and then look to trade any retest of this number thereafter ([waiting for a reasonably sized H4 bull candle, preferably a full-bodied candle, to form following the retest before pulling the trigger is advised] stop loss: ideally beyond the candle’s tail).
- Sells: Flat (stop loss: N/A).
USD/CHF
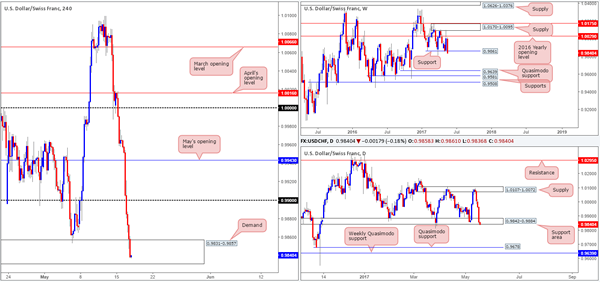
Recent action shows that the USD/CHF extended Monday’s downside move. Intensified by weak US housing data, the pair ended the day crashing into a H4 demand base coming in at 0.9831-0.9857. At the time of writing, the bulls are struggling to generate anything noteworthy from this zone, which could imply that further selling may be on the cards down to the 0.98 handle today.
Spinning over to the bigger picture, the daily support area at 0.9842-0.9884, which happens to hold the weekly support level at 0.9861 within, is under pressure. A decisive (daily) close beyond this hurdle would likely place the daily Quasimodo support at 0.9678 in view, followed closely by weekly support penciled in at 0.9639.
Our suggestions: While we cannot entirely discount the bulls just yet, the upside is not looking favorable at the moment. Just as challenging though would be to sell the break of the current H4 demand area, since the 0.98 handle is located a mere thirty pips away! This leaves little wiggle room for a trade unless you manage to find a setup with a tight stop. With that in mind, we’ll remain on the sidelines for the time being and look to reassess going into Thursday’s open.
Data points to consider: No high-impacting news on the docket today.
Levels to watch/live orders:
- Buys: Flat (stop loss: N/A).
- Sells: Flat (stop loss: N/A).
DOW 30
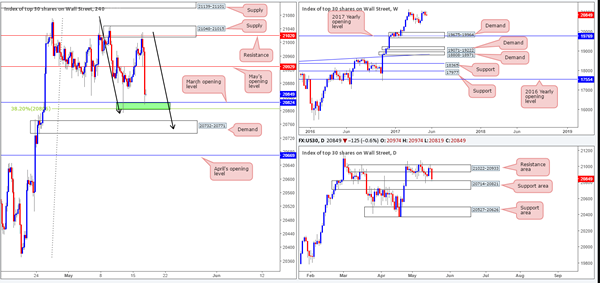
During the course of yesterday’s sessions, the DOW challenged the H4 supply at 21048-21015 (holds a H4 resistance at 21020 within). The reaction from this zone, as you can see, was beautiful! The momentum from this area forced the H4 candles below May’s opening level at 20929 and jabbed into a small area of support formed by March’s opening level at 20824/38.2% Fib support at 20806 (green area).
Of particular interest here is the fact that this H4 green zone is bolstered by a daily support area coming in at 20714-20821 which has been in motion since early March. However, before looking to try and long from here, make sure to take note of the 1:1 correction (see black arrows) that terminates within a H4 demand seen below at 20732-20771, which is also positioned INSIDE the said daily support area.
Our suggestions: Although the market has shown interest at 20806/20824, we’re drawn to the said H4 demand sitting below, due to the possible 1:1 correction! Our team has collectively decided to take an aggressive stance here and place a pending buy order at 20750 and place a stop at 20710. We’ll look to reduce risk to breakeven and liquidate 50% of our position at 20824.
Data points to consider: No high-impacting news on the docket today.
Levels to watch/live orders:
- Buys: 20750 ([pending order] stop loss: 20710).
- Sells: Flat (stop loss: N/A).
GOLD
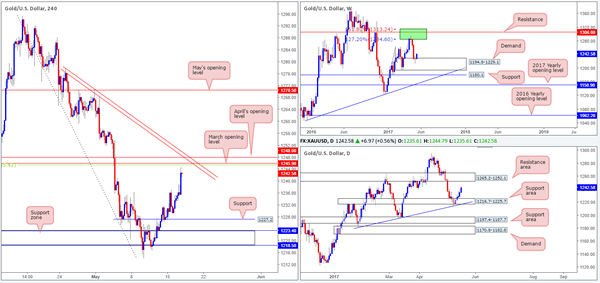
With the continual depreciation being seen in the US dollar, it’s no surprise to see the yellow metal printing advancing candles. As of current price, the technicals show weekly bulls advancing from demand at 1194.8-1229.1, and daily price showing room to advance further up to a resistance zone pegged at 1265.2-1252.1.
On the H4 chart, however, we have an extremely attractive resistance area planted just ahead of current price. It is comprised of March/April’s opening levels at 1245.9/1248.0, a H4 trendline resistance taken from the high 1278.0 and a 38.2% Fib resistance at 1245.4 (green line) drawn from the high 1295.4. So, the question is, would you be comfortable shorting from here knowing that you’re potentially going up against higher-timeframe buyers?
Our suggestions: In light of the H4 confluence surrounding the 1245.0 region, our team does expect a bounce to be seen. We would, if we’re able to pin down a lower-timeframe sell signal here, consider selling this market. However, we must stress that we’d adopt incredibly aggressive trade management, since getting caught on the wrong side of higher-timeframe flow will not likely end too well for your account!
Levels to watch/live orders:
- Buys: Flat (stop loss: N/A).
- Sells: 1245.9 region ([waiting for a lower-timeframe confirming signal to form is advised [see the top of this report] stop loss: dependent on where one confirms this area).
