After featuring AUD/JPY stepping down between support/resistance levels in Monday’s blog, I wanted to continue the Yen theme with a similar setup on GBP/JPY.
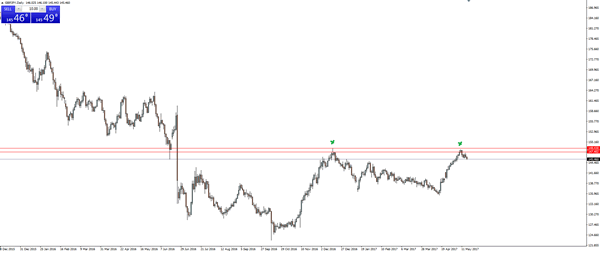
First up we have a higher time frame resistance zone on the daily chart which price re-tested and subsequently held:
GBP/JPY Daily:

You can seen just before the Brexit drop back in June 2016, that price also bounced off this zone as it looked like the vote would be a sure thing to the stay side. Just quietly, how good is hindsight!
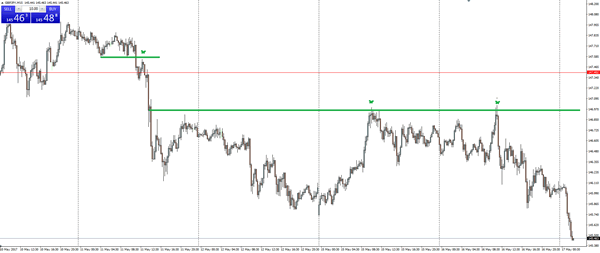
Secondly, we zoom into an inraday chart with the 15 minute featured here to show how price then stepped between short term levels off the higher time frame resistance level:
GBP/JPY 15 Minute:

That is a textbook intraday bearish trending market where price breaks short term support, retests it as resistance, then continues downward repeating the pattern again and again.
How do you expect price to react now that the swing low has broken? Will the pattern continue?
