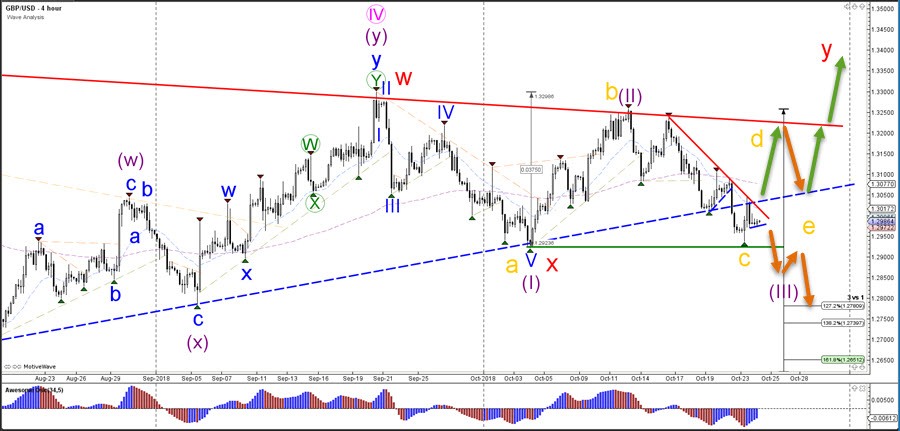
The GBP/USD broke the support trend line (blue) for a bearish breakout but price needs to push below the previous bottom (green) before a wave 3 (purple) has a higher chance of becoming confirmed.
If the GBP/USD fails to break below the previous bottom (green) and manages to rebreak above the broken support line, then price has probably invalidated the wave 3.In that case a bullish ABCDE (gold) triangle pattern is taking place.
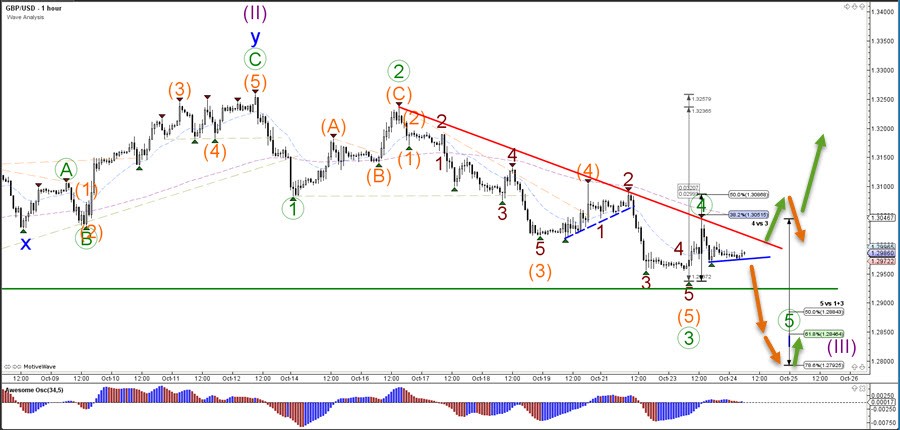
The GBP/USD is in a potential wave 4 (green) as long as price stays below the 50% Fibonacci resistance level. A break above the 50% Fibonacci level could see price move up higher where as a break below support could see price move lower as part of the downtrend.