
Key Highlights
- The Australian Dollar was recently rejected near the 0.7350-60 resistance against the US Dollar.
- There is a crucial bearish trend line formed with resistance at 0.7335 on the 4-hour chart of AUD/USD.
- The US GDP in Q2 2018 (Prelim) grew 4.2%, more than the forecast of 4.0%.
- Today, the US Personal Income for July 2018 will be released, which is forecasted to rise 0.3% (MoM).
AUDUSD Technical Analysis
There was a decent recovery from the 0.7235 support by the Australian Dollar against the US Dollar. The AUD/USD pair traded above 0.7300, but it faced a strong resistance near the 0.7350 and 0.7360 levels.
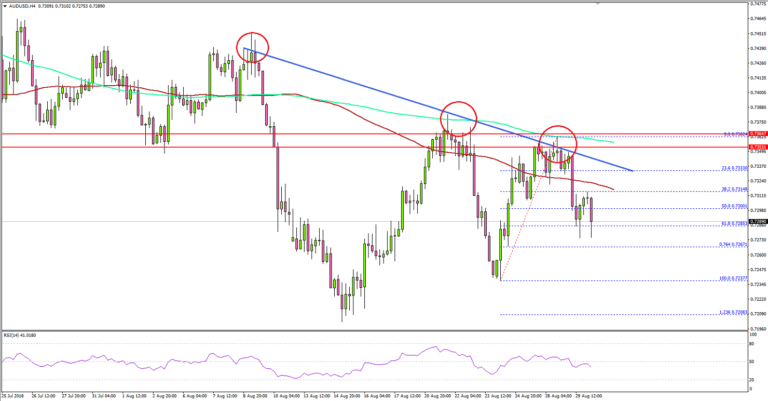
Looking at the 4-hours chart, the pair traded above the 0.7320 resistance and the 100 simple moving average (red). However, the upside move was capped by a significant resistance near 0.7360, which was a support earlier.
Additionally, the 200 simple moving average (green, 4-hours) also acted as a resistance near 0.7362. More importantly, there is a crucial bearish trend line formed with resistance at 0.7335 on same chart.
The pair declined and broke the 50% fib retracement level of the last wave from the 0.7237 low to 0.7362 high. There was also a close below the 0.7320 level and the 100 SMA.
These all are negative signs and indicates that the pair may continue to decline towards 0.7250 and 0.7230 in the near term. To move into a bullish zone, AUD/USD must break the trend line, 200 SMA, and the 0.7360 resistance zone.
Fundamentally, the US Gross Domestic Product report for Q2 2018 (Prelim) was released by the US Bureau of Economic Analysis. The market was looking for a growth of around 4% in Q2 2018.
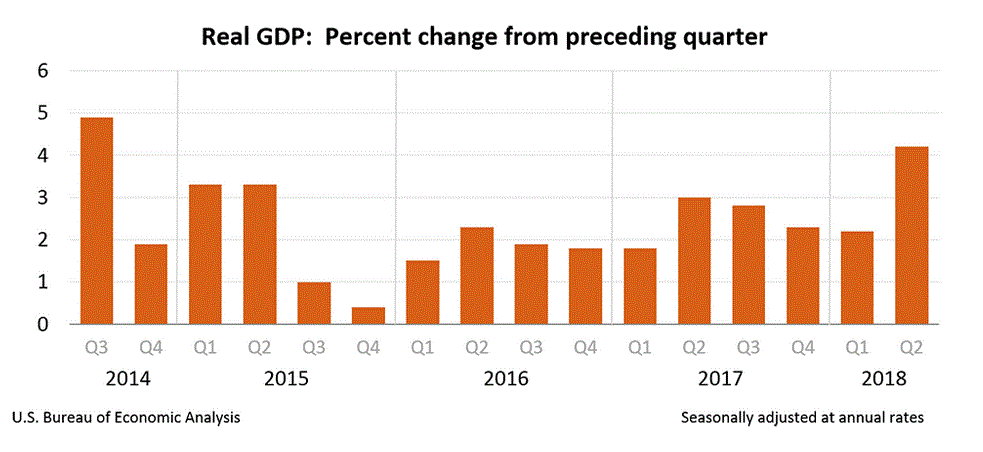
The actual result was better than the forecast as the US GDP grew 4.2% in Q2 2018 as per the “second” estimate. Moreover, the real gross domestic income (GDI) rose 1.8% in Q2 2018. The report added that:
The increase in real GDP in the second quarter reflected positive contributions from PCE, nonresidential fixed investment, exports, federal government spending, and state and local government spending that were partly offset by negative contributions from private inventory investment and residential fixed investment. Imports decreased.
The greenback got traction after the release and there was a pullback noted in GBP/USD and EUR/USD, but both pairs later recovered.
Economic Releases to Watch Today
- German Consumer Price Index for August 2018 (YoY) (Prelim) – Forecast +2%, versus +2% previous.
- German Consumer Price Index for August 2018 (MoM) (Prelim) – Forecast +0.1%, versus +0.3% previous.
- Germany’s Unemployment Change for August 2018 – Forecast -8K, versus -6K previous.
- Germany’s Unemployment Rate for August 2018 – Forecast 5.2%, versus 5.2% previous.
- Euro Zone Consumer Confidence August 2018 – Forecast -1.9, versus -1.9 previous.
- Euro Zone Economic Sentiment Indicator August 2018 – Forecast 112.0, versus 112.1 previous.
- US Personal Income for July 2018 (MoM) – Forecast +0.3%, versus +0.4% previous.
- US Initial Jobless Claims – Forecast 214K, versus 210K previous.