
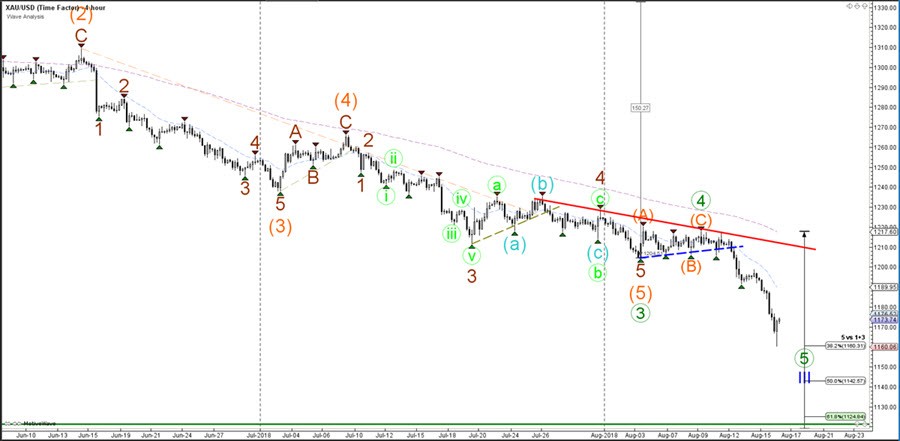
Gold (XAU/USD) showed a strong bearish breakout below the contracting triangle chart pattern. The price action is showing bearish impulsive price action which seems to be extending the bearish wave 3 (blue).
Gold is now falling towards the Fibonacci targets of wave 5. Price can extend the bearish impulse towards deeper Fib targets but eventually price is expected to build a wave 4 correction pattern
Day
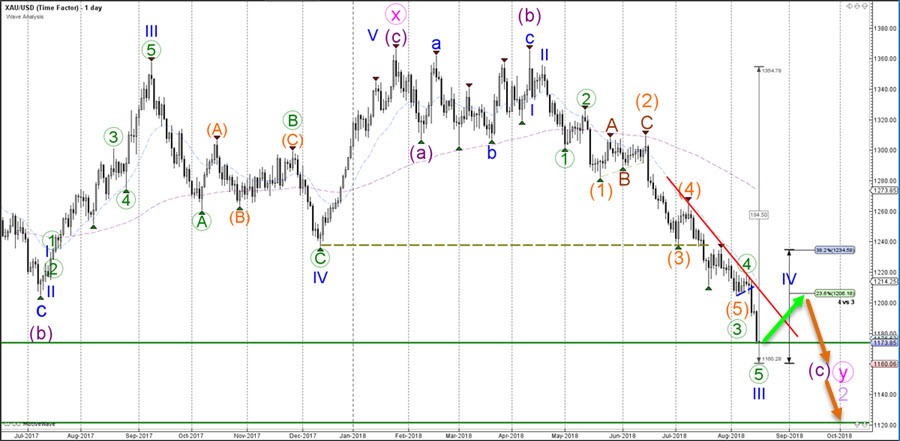
XAU/USD is showing strong bearish momentum which seems to be part of a wave 3 (blue). A bullish pullback could be limited as price could respect and bounce at the Fibonacci retracement and resistance levels of wave 4 vs 3. A new low could finally complete wave 5 (blue) of wave C (purple).
Week
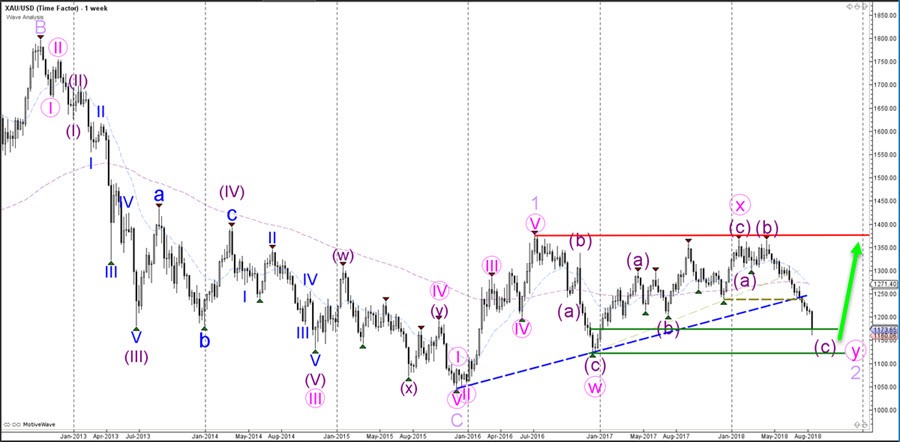
Despite the bearishness on the lower time frames, XAU/USD could soon be reaching a key support zone. If the wave pattern is correct, price is expected to show a bullish bounce at the support zone (green lines) because price could be completing a larger wave 1-2 (light purple) pattern.