HomeContributorsTechnical AnalysisGBP/USD Bearish Breakout Below Bear Flag Chart Pattern

GBP/USD Bearish Breakout Below Bear Flag Chart Pattern

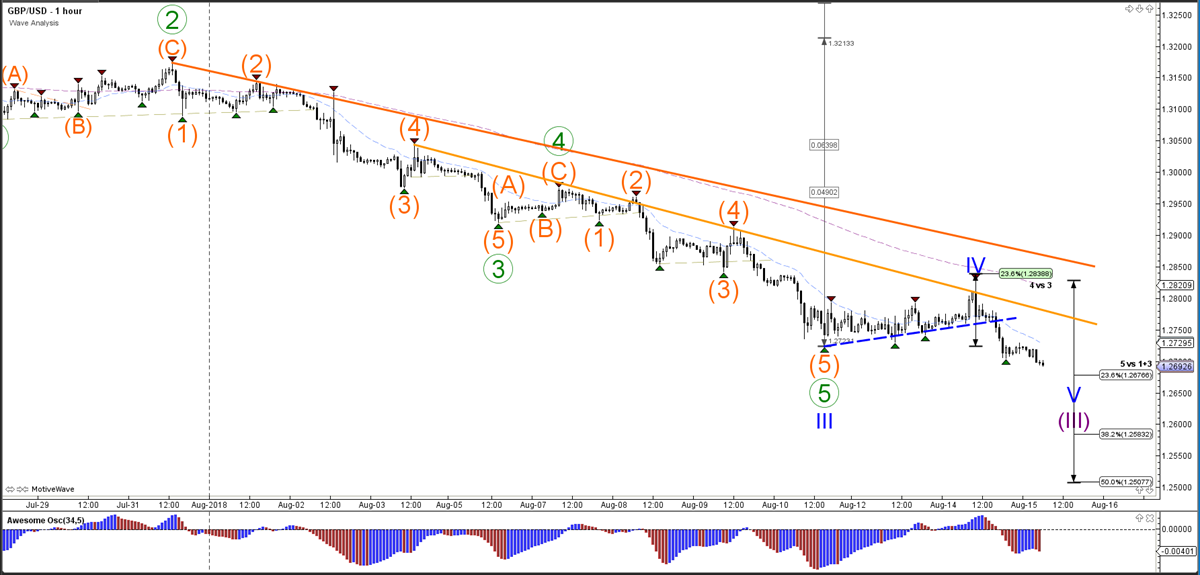
The GBP/USD made a bullish retracement and bearish continuation as expected in our wave analysis earlier this week. The GBP/USD broke below the support trend line (dotted blue) for a new low after a bearish bounce occurred at the 23.6% Fibonacci retracement level of wave 4 vs 3.

The GBP/USD broke the bear flag chart pattern and is now continuing the downtrend.

admiral
admiralhttps://www.elitecurrensea.com/
Elite CurrenSea Accessible Forex Trading Systems & Education With over 30 years of combined trading experience, we design, test, and provide successful Forex, CFDs & Crypto trading systems and solutions for retail and institutional traders alike.

Featured Analysis

Learn Forex Trading

Supply and Demand Trading

How to Use Pivot Points

Fixed Or Moving Stop Losses

How to Identify Trendlines