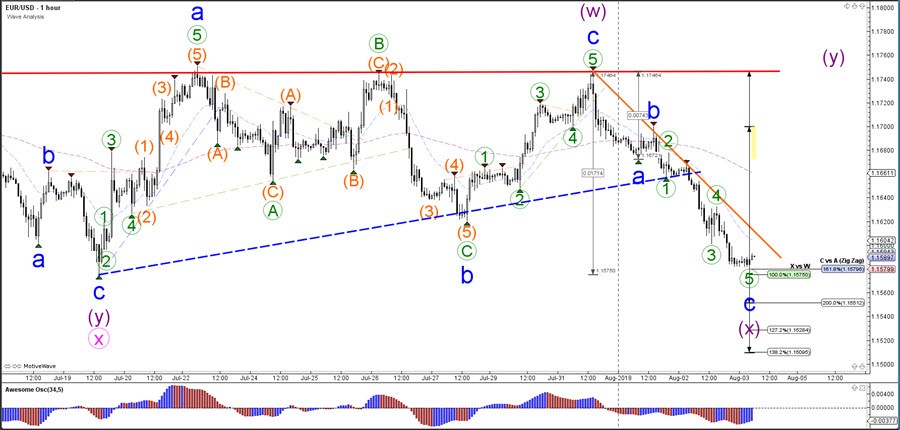
The EUR/USD fell down towards the bottom of the sideways range (blue line) and 100% Fibonacci level of wave X (purple), which is a new decision zone for a bullish bounce or bearish breakout.
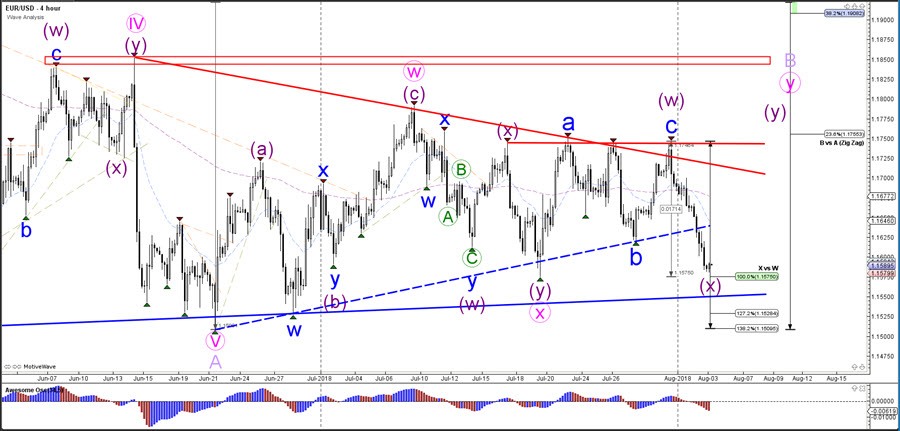
The EUR/USDis building a large corrective pattern and consolidation zone. Price has again reached the bottom and potential support. A larger bullish correction is possible via a WXY (purple) pattern unless price breaks below the support trend line. A bearish breakout is certainly possible when considering the strong bearish momentum.
The EUR/USD could have completed an ABC (blue) zigzag pattern but it depends how the price patterns that develop at the Fibonacci targets. If price moves sideways and builds a bear flag pattern, then a wave 3 rather than a wave C (blue) becomes a more likely scenario. A strong bullish bounce and break above the resistance trend line (orange) however would confirm the development of an ABC within wave X.