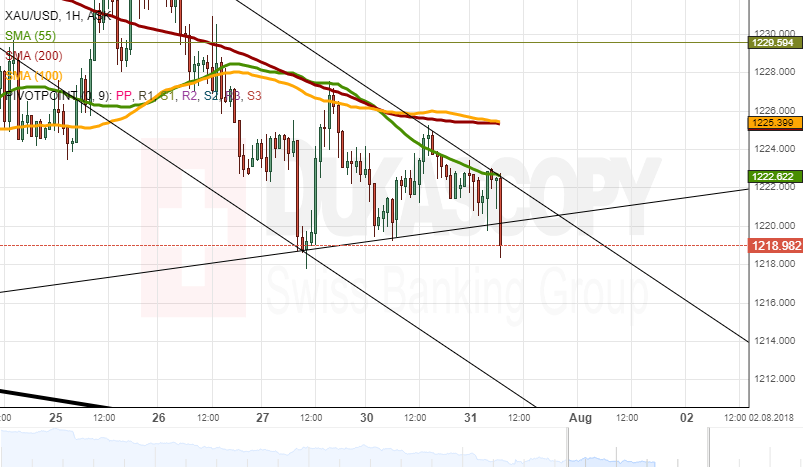
Gold trading above the 1,220.00 mark during the following two sessions has revealed a two-week ascending triangle. XAU/USD has recently failed to accelerate from its bottom boundary, being bounded by the 55-, 100– and 200-hour SMAs.
Technical indicators on longer-term charts show that the tendency does remain upwards, so it is likely that the nearest resistance cluster at 1,225.580 is breached. In line with this scenario, the yellow metal should aim for the upper triangle line at 1,235.00.
In case the 55-period (4H) and -hour SMAs prove to be stronger, this pattern should be breached to the downside. The next support is the monthly S2 at 1,206.00. It should be noted that monthly pivot points will be recalculated tomorrow, as a new month begins.