
The EUR/USD currency pair
Technical indicators of the currency pair:
Prev Open: 1.16920
Open: 1.16805
% chg. over the last day: -0.06
Day’s range: 1.16777 – 1.16836
52 wk range: 1.0571 – 1.2557
Yesterday a variety of trends was observed on the EUR/USD currency pair. The index of economic activity in the manufacturing sector of Germany was published, which counted to 57.3, while experts expected the value of 55.5. At the moment, the technical pattern is ambiguous. Investors expect additional drivers. The key support and resistance levels are 1.16750 and 1.17100, respectively. We recommend opening positions from these marks.
The news feed on 2018.07.25:
German IFO business climate index at 11:00 (GMT+3:00);
New home sales in the US at 17:00 (GMT+3:00).
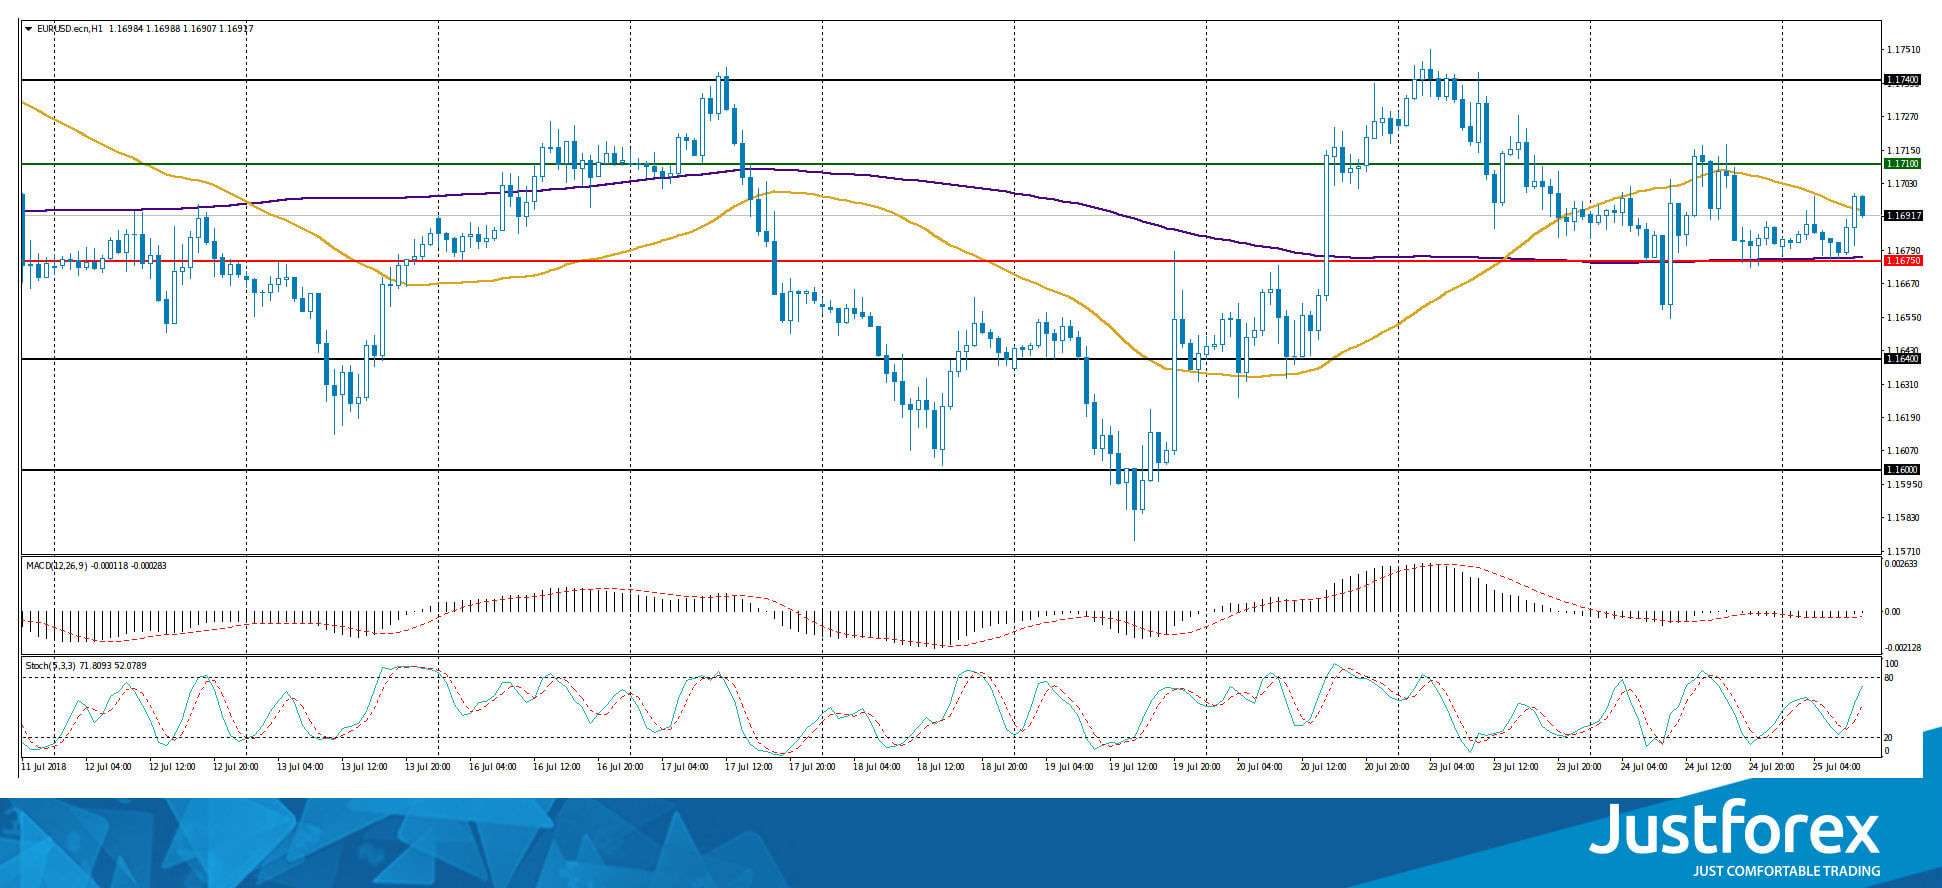
Indicators do not send accurate signals: the price is testing 50 MA.
The MACD histogram is located in the negative zone, but above the signal line, which gives a weak signal to sell EUR/USD.
Stochastic Oscillator is in the neutral zone, the %K line is above the %D line, which indicates the power of the buyers.
Trading recommendations
Support levels: 1.16750, 1.16400, 1.16000
Resistance levels: 1.17100, 1.17400
If the price fixes below 1.16750, we recommend considering sales of EUR/USD. The movement is tending to 1.16400-1.16200.
Alternative option. If the price fixes above the resistance level of 1.17100, the EUR/USD quotes are expected to grow. The movement is tending to 1.17400-1.17600.
The GBP/USD currency pair
Technical indicators of the currency pair:
Prev Open: 1.30944
Open: 1.31421
% chg. over the last day: +0.37
Day’s range: 1.31610 – 1.31738
52 wk range: 1.2361 – 1.4345
During yesterday’s trading session, the GBP/USD currency pair strengthened. Quotes rose by more than 70 points. At the moment, the key levels of support and resistance are: 1.31400 and 1.31900, respectively. The positions must be opened from these marks. The trading instrument is tending to grow.
The news feed on the UK economy is calm.
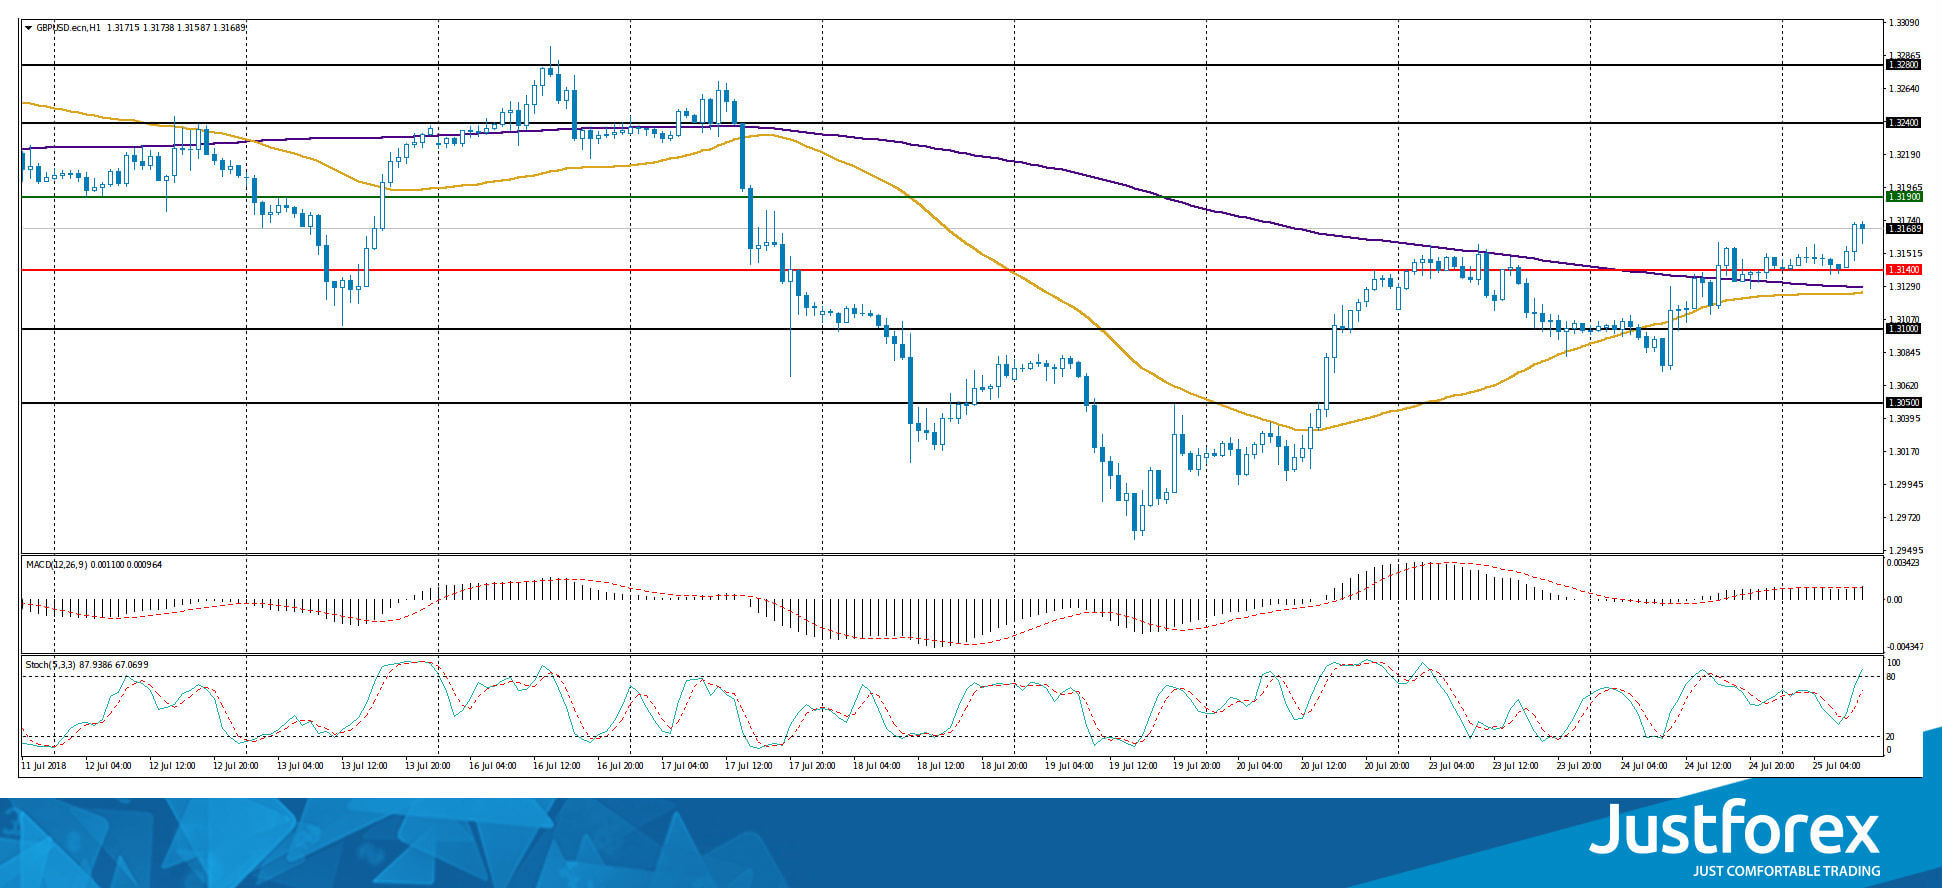
Indicators point to thw power of buyers: the price has fixed above 50 MA and 200 MA.
The MACD histogram is in the positive zone and above the signal line, which sends a signal to buy GBP/USD.
Stochastic Oscillator is located in the neutral zone, the %K line is above the %D line, which also sends a signal to buy GBP/USD.
Trading recommendations
Support levels: 1.31400, 1.31000, 1.30500
Resistance levels: 1.31900, 1.32400, 1.32800
If the price fixes above 1.31900, further growth of GBP/USD is expected. The movement is tending to 1.32400-1.32600.
Alternative option. If the price fixes below the support of 1.31400, it is necessary to consider sales of GBP/USD. The movement is tending to 1.31000-1.30800.
The USD/CAD currency pair
Technical indicators of the currency pair:
Prev Open: 1.31667
Open: 1.31542
% chg. over the last day: -0.16
Day’s range: 1.31491 – 1.31575
52 wk range: 1.2059 – 1.3795
There is an ambiguous technical pattern on the USD/CAD currency pair. At the moment, the trading instrument is in a sideways trend. Local support and resistance levels are: 1.31350 and 1.31650, respectively. The positions must be opened from these marks. We recommend paying attention to the dynamics of oil quotations.
Publication of important news from Canada is not expected.
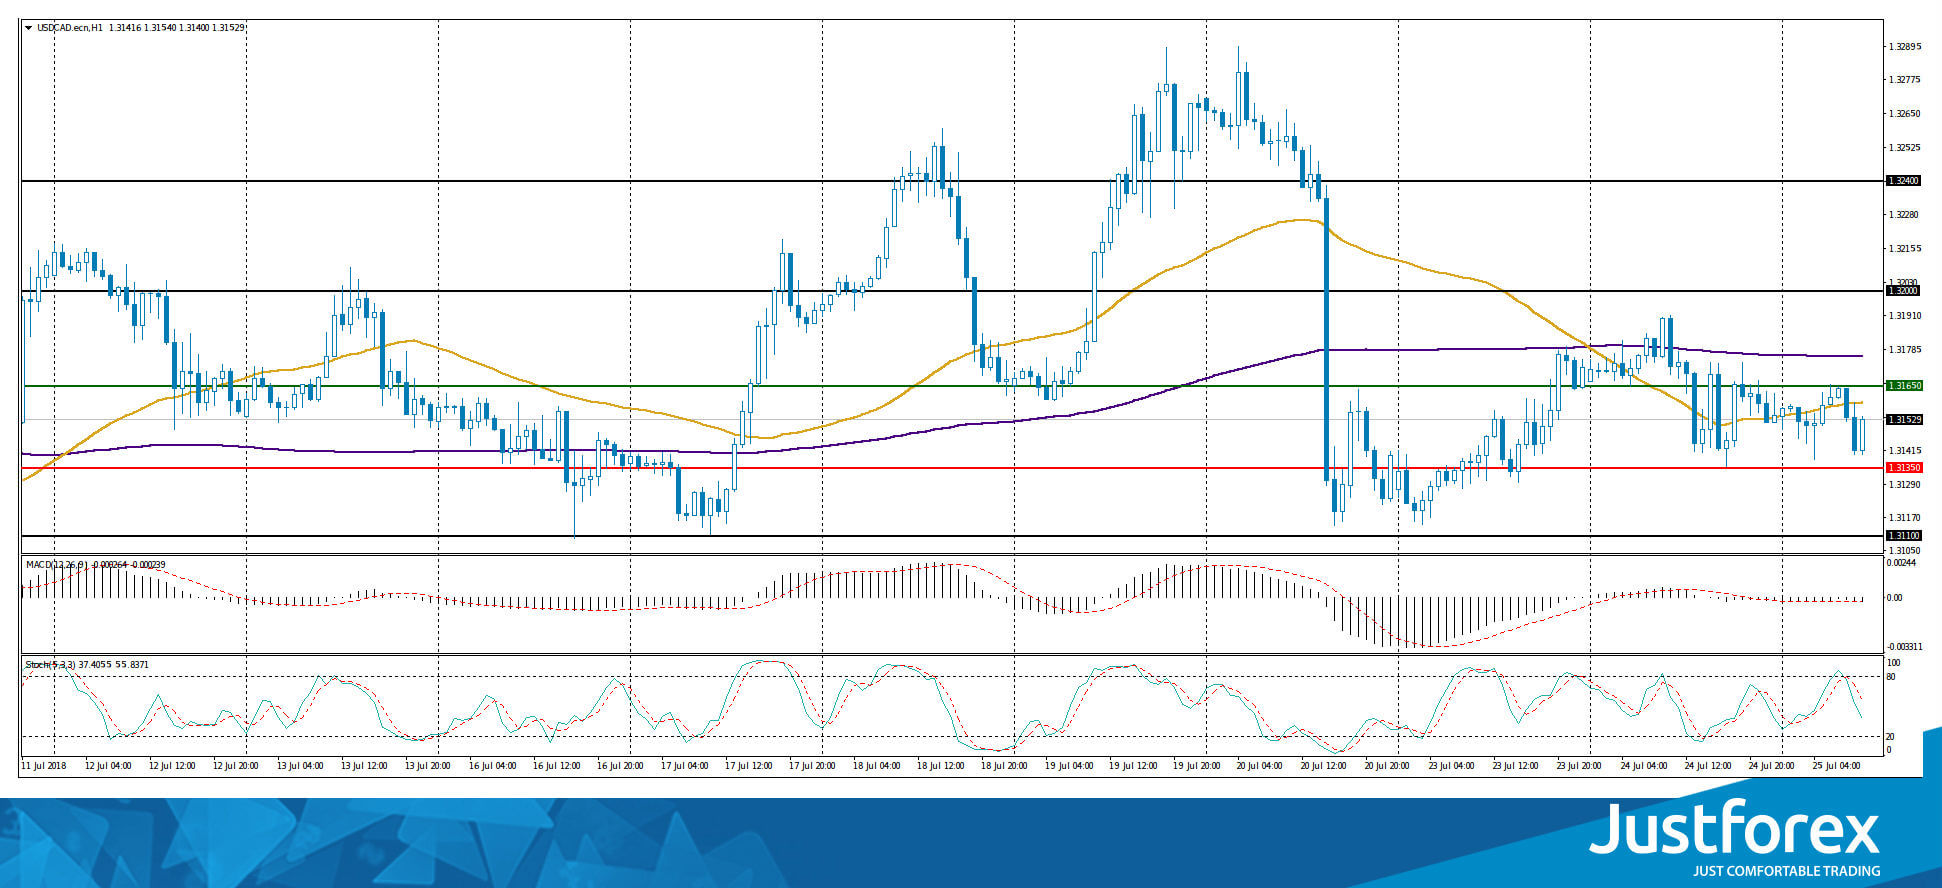
Indicators point to the power of sellers: the price has fixed below 50 MA and 200 MA.
The MACD histogram is near the mark 0. There are no accurate signals.
Stochastic Oscillator is in the neutral zone, the %K line is below the %D line, which gives a signal to sell USD/CAD.
Trading recommendations
Support levels: 1.31350, 1.31100
Resistance levels: 1.31650, 1.32000, 1.32400
If the price fixes below the support level of 1.31350, a decline of the currency pair is expected. The movement is tending to 1.31100-1.30900.
If the price fixes above the level of 1.31650, one should look for entry points to the market to open long positions. The target movement level is 1.32250-1.32600.
The USD/JPY currency pair
Technical indicators of the currency pair:
Prev Open: 111/325
Open: 111.141
% chg. over the last day: -0.05
Day’s range: 111.240 – 111.310
52 wk range: 104.56 – 114.74
There is an ambiguous technical pattern on the USD/JPY currency pair. The trading instrument is in a sideways trend. Investors expect additional drivers. The key support and resistance levels are: 111.100 and 111.400, respectively. We recommend opening positions from these marks.
The news feed on Japan’s economy is calm.
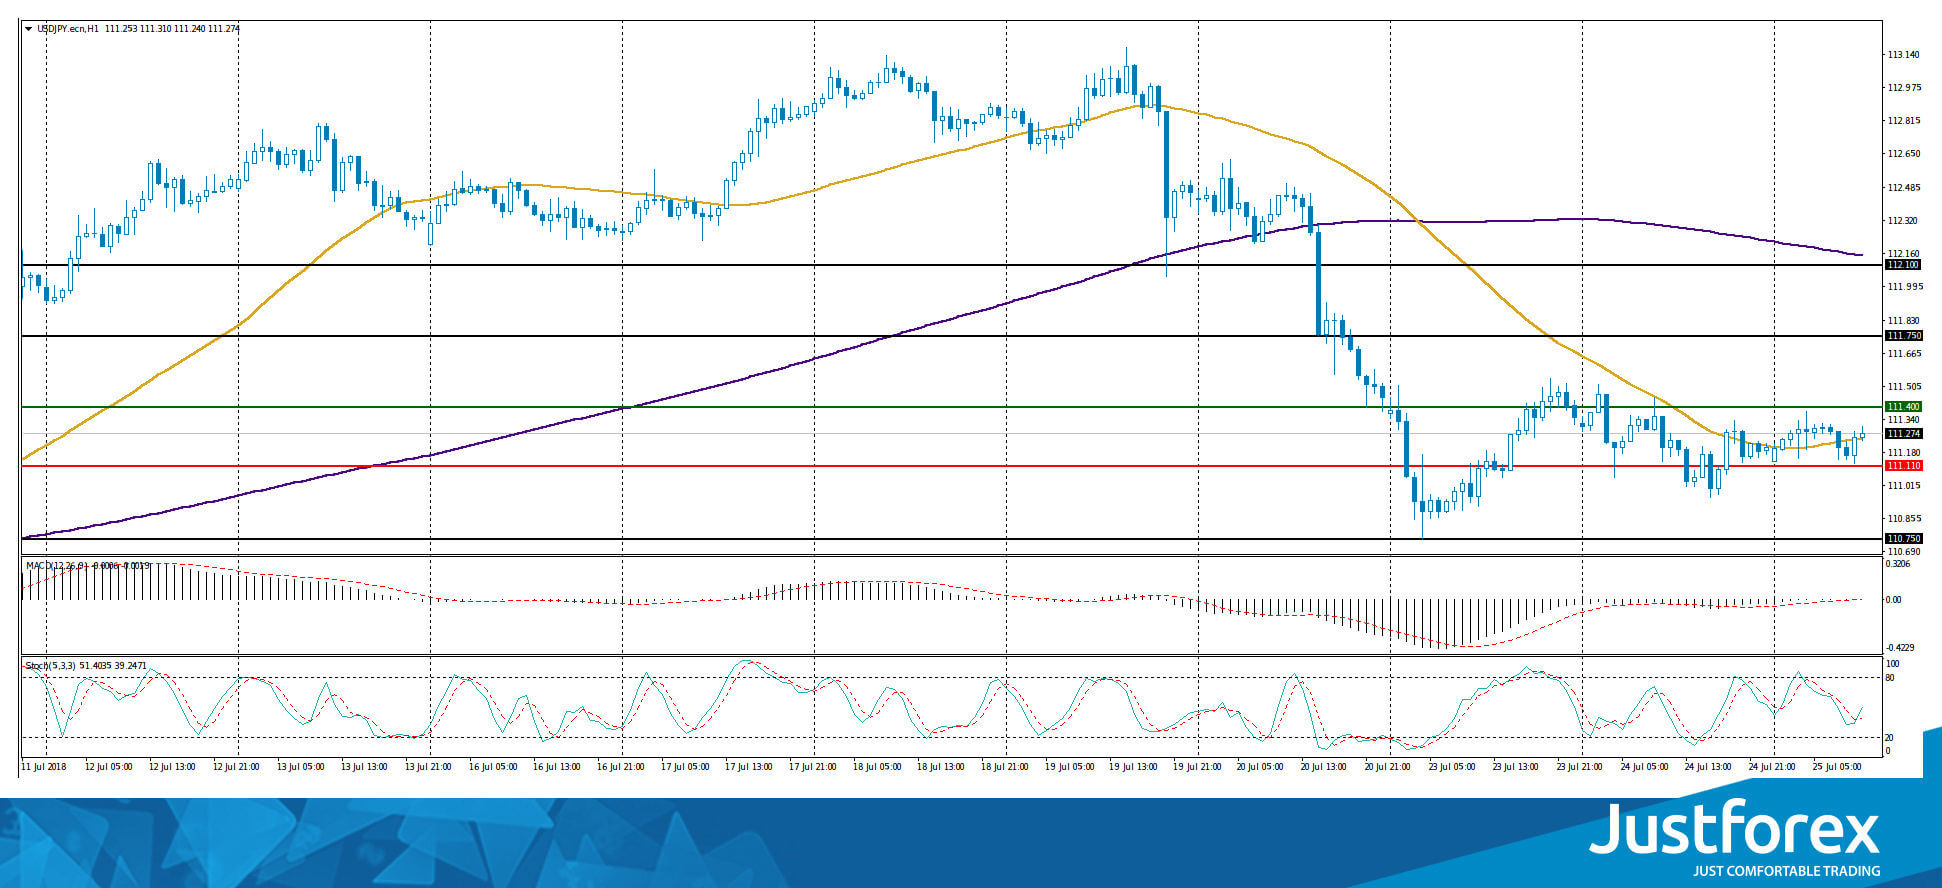
Indicators do not send accurate signals: the price is testing 50 MA.
The MACD histogram is near the 0 mark.
Stochastic Oscillator is located in the neutral zone, the %K line has crossed the %D line. There are no accurate signals.
Trading recommendations
Support levels: 111.100, 110.750
Resistance levels: 111.400, 111.750, 112.100
If the price fixes below the 111.100 level, the USD/JPY currency pair is expected to decline. The movement is tending to 110.750-110.500.
Alternative option. If the price fixes above the level of 111.400, it is necessary to consider buying USD/JPY. The movement is tending to 111.750-112.100.