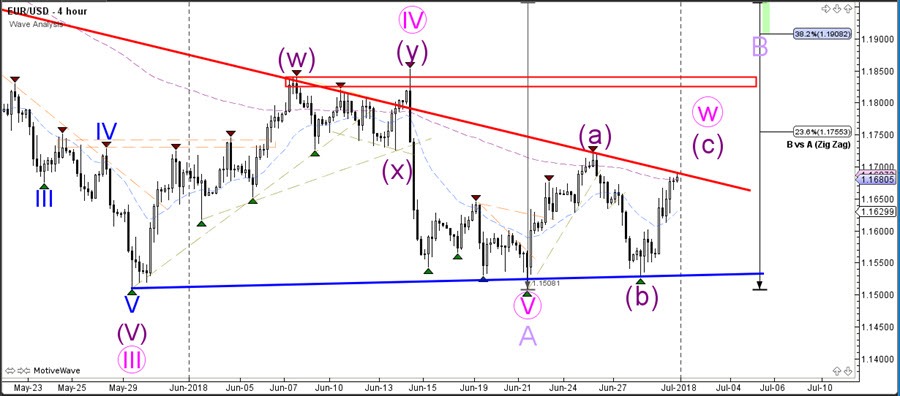
The EUR/USD is approaching multiple key resistance zones, which are decisive bounce or break spots. A bearish bounce could send price back to support whereas a bullish breakout could indicate one more push higher.
The EUR/USD could also be in wave 4 (pink) if price manages to break below the support trend line (blue). For the moment price is probably completing a bullish wave C (purple) within wave W (pink), which indicates that a bearish retracement could be part of a wave X.
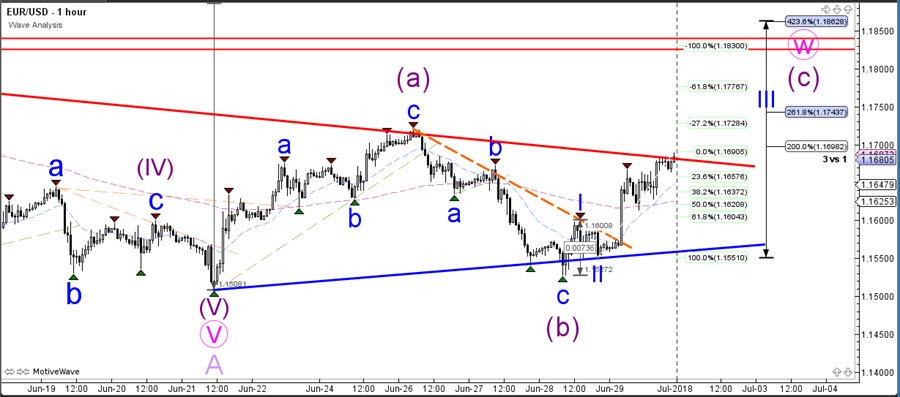
The EUR/USD might not have completed the wave C (purple) if price is indeed in a wave 3 (blue) at the moment. To confirm a wave 4, the EUR/USD needs to bounce at the Fibonacci levels. A break below the 61.8% Fib at 1.16 invalidates this particular wave pattern.