
.)
Key Highlights
- Gold price traded higher recently and succeeded in breaking the $1,335 resistance against the US Dollar.
- A crucial bearish trend line with resistance at $1,330 was breached on the 4-hours chart of XAU/USD.
- The US Consumer Price Index increased 0.5% in Jan 2018, more than the forecast of 0.3% (MoM).
- The US Retail Sales declined 0.3% in Jan 2018, compared with the forecast of +0.2% (MoM).
Gold Price Technical Analysis
There was a bullish price action in Gold price earlier this week above $1,325 against the US Dollar. Later, the price gained upside momentum and broke a major resistance at $1,335.
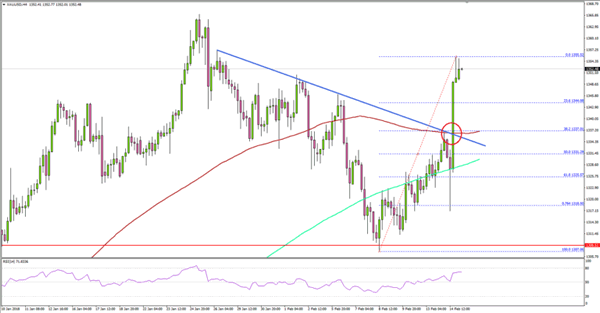
More importantly, there was a break above a crucial bearish trend line with resistance at $1,330 on the 4-hours chart of XAU/USD. The trend line resistance was also near the 100 simple moving average (red, 4-hours).
Therefore, the $1,335 level break holds a lot of significance. The price traded as high as $1,355 recently. On the downside, an initial support is around the 23.6% Fib retracement level of the last wave from the $1,307 low to $1,355 high.
However, the most important support is near $1,335 (previous resistance). It is also near the 38.2% Fib retracement level of the last wave from the $1,307 low to $1,355 high.
In the short term, the price may consolidate above $1,345, with supports at $1,340 and $1,335. On the upside, a break above $1,355 could push the price towards $1,365.
US CPI and Retail Sales
Recently, the US saw two important releases. First, the Consumer Price Index for Jan 2018 by the US Bureau of Labor Statistics. The market was looking for a rise of 0.3% in the CPI compared with the previous month.
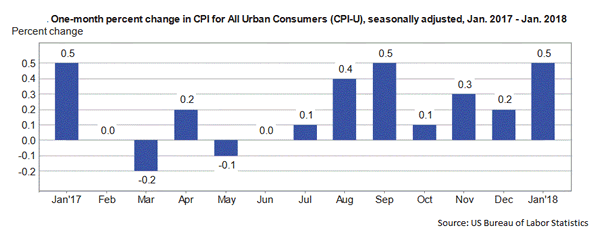
The actual result was better, as there was a 0.5% rise in the CPI (MoM). The yearly change came in at 2.1%, more than the forecast of 1.9%, but similar to the last. The report added that:
The seasonally adjusted increase in the all items index was broad-based, with increases in the indexes for gasoline, shelter, apparel, medical care, and food all contributing. The energy index rose 3.0 percent in January, with the increase in the gasoline index more than offsetting declines in other energy component indexes. The food index rose 0.2 percent with the indexes for food at home and food away from home both rising.
The second release was the Retail Sales for Jan 2018 by the US Census Bureau. The result was disappointing, as there was a 0.3% decline in sales compared with the previous month, whereas the market was looking for a 0.2% rise.
The US Dollar gained initially after the release, but it later declined heavily. EUR/USD jumped from 1.2280 to 1.2450 and GBP/USD moved above 1.4000. However, there was a no relief for the USD/JPY buyers, as the pair tumbled to a new 15-month low and traded below 107.00.