Key Highlights
- Crude oil price struggled to break the $66.50-66.70 resistance area and declined against the US dollar.
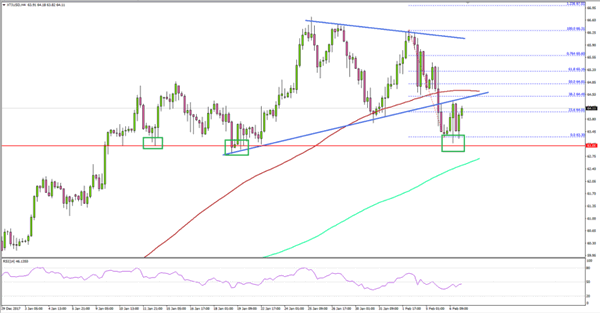
- There was a break below a key contracting triangle with support at $64.30 on the 4-hours chart of XTI/USD.
- The $63.00 level is a crucial support on the downside followed by $62.60.
- The US Trade Balance in Dec 2017 posted a trade deficit of $-53.1B.
Crude Oil Price Technical Analysis
There were sharp gains in crude oil price in January 2018 as it moved above the $65.00 level against the US dollar. However, the price struggled to break the $66.50-66.70 resistance area and declined recently.

Looking at the 4-hours chart of XTI/USD, there was a downside wave initiated from the $66.31 high. The price fell below the $65.00 and $64.50 support levels to settle below the 100 simple moving average (red, 4-hours).
More importantly, there was a break below a key contracting triangle with support at $64.30 on the same chart. The price traded as low as $63.30 and is currently consolidating losses. On the upside, an initial resistance is around the 23.6% Fib retracement level of the last decline from the $66.31 high to $63.30.
On the downside, there is a crucial support near $63.00, which prevented declines on many occasions previously. If the price fails to stay above $63.00, it could test the $62.60 support and the 150 simple moving average (green, 4-hours).
Overall, it seems like the price has formed a short-term top near $66.30. The next move in XTI/USD depends on whether buyers can prevent a break below $63.00 or not in the near term.
US Trade Balance
Recently in the US, the Trade Balance report for Dec 2017 was released by the Bureau of Economic Analysis and the U.S. Census Bureau. The forecast was slated for a trade deficit of $-52.0B, compared with the last $-50.5B.
However, the actual reading was a bit lower as the trade deficit in Dec 2017 was $-53.1B. The last reading was revised to $-50.4B. The report added that:
The December increase in the goods and services deficit reflected an increase in the goods deficit of $2.6 billion to $73.3 billion and a decrease in the services surplus of $0.1 billion to $20.2 billion.
There was no negative impact on the greenback. On the contrary, it gained and pairs such as EUR/USD and GBP/USD extended their decline.
