Key Highlights
- The British Pound started a downside move after trading as high as 1.4345 against the US Dollar.
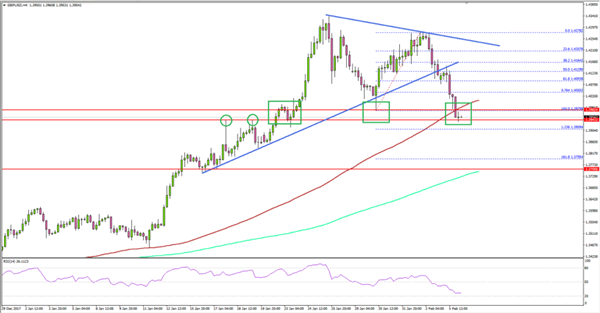
- There was a break below a key bullish trend line with support at 1.4130 on the 4-hours chart of GBP/USD.
- Two important supports on the downside 1.3950 and 1.3920 hold a lot of significance in the short term.
- The UK British Retail Consortium (BRC) Like-For-Like Retail Sales rose 0.6% in Jan 2018, similar to the forecast.
GBPUSD Technical Analysis
There were decent bullish moves in British Pound above 1.4200 this past week against the US Dollar. Later, the GBP/USD pair started a downside correction and is currently testing the 1.3950 support region.

Looking at the 4-hours chart of GBP/USD, the pair recently failed to move above 1.4280 and a bearish trend line with current resistance at 1.4210. It started a downside move and broke a key bullish trend line with support at 1.4130.
It sparked further losses and the pair declined below the 61.8% Fib retracement level of the last wave from the 1.3979 low to 1.4278 high. It seems like the pair could decline further towards 1.3940-50 support area.
The mentioned 1.3950 zone is a major support, and therefore a break below the stated 1.3950 level could push the pair towards the next key support at 1.3920. Further below 1.3920, the pair may perhaps move back in a bearish zone, with supports at 1.3800 and 1.3750.
On the upside, an initial resistance is around the 1.4100 level. Above 1.4100, the bearish trend line with current resistance at 1.4210 might prevent upsides.
US Services PMI and Dollar’s Recovery
Recently, the US saw the release of the Services Purchasing Managers Index (PMI) for Jan 2018 by Markit Economics. The forecast was slated for no change in the PMI from 53.3 in Jan 2018.
The actual result was in line with the forecast as there was no change in the PMI in Jan 2018 from 53.3.
Broadly, the US Dollar is slowly recovering as EUR/USD moved down recently and traded below 1.2400. However, the greenback is still struggling to break a major resistance area at 110.20-110.40 versus the Japanese Yen (as discussed in the last USD/JPY analysis), and it declined below 109.50.
