Week beginning 22 January 2018
- Employment robust in 2017 but December unlikely the tipping point for wages.
- Australia: Westpac-MI Leading Index, Australia Day holiday.
- NZ: Q4 CPI.
- US: Q4 GDP.
- Central banks: ECB policy meeting and BoJ policy decision.
- Key economic & financial forecasts.
Information contained in this report was current as at 19 January 2018.
Employment robust in 2017 but December unlikely the tipping point for wages
December sealed a solid year for the labour market
Total employment rose by 34.7k in December, well above both the market’s (+15k) and Westpac’s (-10k) expectations with a small upward revision to November (to 63.6k from 61.6k). But most notably, despite the solid gains in employment, the unemployment rate rose to 5.5% as a 0.2ppt rise in participation boosted the labour force by 55.2k. In the year total employment gained 403k or 3.3%.
The surge in employment also saw further solid gains in full-time employment (+15.1k). In the year full-time employment gained 303.4k. Part-time employment rose 19.5k to be up 99.7k/2.61%yr. Total hours worked did ease back a touch (-0.2%mth) but they are still up a solid 3.2%yr. In the month the dip in hours worked was due to a decline in hours worked per full-time employee; hours worked per part-time employee was flat.
This was the 15th consecutive monthly gain in employment matching the longest period of consecutive employment which ended July 1994. There is every chance we could see a record 16th consecutive gain in January.
Females continue to be the dominate force for employment …
Female employment continues to outpace male employment, not just in growth rates but also in absolute terms. In the year to December female employment has lifted 4.3%yr or 238.9k. Male employment lifted 164.1k/ 2.6%yr. As noted below we believe this reflects both structural and cyclical factors that are driving a surge in services employment particularly for heath and education.
… and participation
Female participation has risen 0.7ppt in the last six months, 1.3ppts in the year. So while male participation has also improved, 0.4ppt in six months and 0.5ppt in the year, and overall is still higher than female participation (71.0% vs. 60.6%) the robust gain in female employment is being more than matched by gains in female participation.
That is the supply of female labour is rising to match the rise in female employment. This is a key reason we believe to why the unemployment rate will hold around current levels through the first half of 2018 even with further robust gains in employment.
Female employment lifts on the back of strong growth in the services sectors
In the year to November (sector date is released in the mid-month of each quarter) health care & social services made the single largest contribution to the gain in employment of 134.7k. A bit further back was construction (102k) but then it was education & training (60.8k), accommodation & food services (38.7k), retail trade (35.8k) then transport, postal & warehousing (29.9k). So of the top five sectors for employment four were those that have a higher than average share of female employees. And this rising demand for labour has drawn both more females into the workforce and encouraged more females to extend their working life (female average retirement age is still lower than males but rising). That is the supply of labour is rising to meet demand and is part of the reason why unemployment has not fallen further and, more importantly, why we are yet to see any wage pressure even in the sectors with robust employment growth.
Mining states & NSW driving the recovery of employment
In December the main gains in employment came from NSW (+14.3k) and WA (6.1k). In the month NSW unemployment lifted to 4.8% from 4.6% in November, but it is still down from the 2017 high of 5.2%. Unemployment has been somewhat more volatile in Vic rising to 6.1% in December from 5.5% in November (the previous peak was 6.1% in August). Qld unemployment was 6.0% vs. 5.9% in November and a peak of 6.4% in June. WA has seen quite a bit of volatility printing 5.7% in December compared to 6.6% in November and an earlier peak of 6.4% in March.
By state, Vic continued to motor in 2017 but the pace of employment growth slowed from 4%yr at the start of the year to 2.9%yr by December. In the year to December Victorian employment grew by 87.7k compared to a 139.7k lift in NSW and a 100.6k gain in Qld. Even WA contributed a surprising 49.9k gain in 2017 (a 3.0%yr pace). So while the labour market is still quite robust in Victoria the recovery is being driven by the mining states and NSW.
This is also seen in the lift in state participation. While Victorian participation is still higher than what it is in NSW (66.4% vs. 64.6%) in the year participation lifted 0.97ppt in NSW and just 0.37ppt in Victoria. In Qld participation has lifted 1.53ppt in the year (to 65.8%) while in WA it rose 1.47ppt through to a national high of 68.5%.
A solid update on the labour market
December employment again exceeded expectations and continues to be underpinned by the robust leading indicator of the labour market. It confirms that we are in the midst of a better than expect expansion of the labour market so while we do note that the ABS reports some sample volatility issues, (the incoming rotation group had a higher employment to population ratio than both the group it replaced and the entire sample) we are cautious about looking for a January correction.
January is subject to a large positive seasonal adjustment associated with a usual significant dip in original employment over the Australian summer holidays. As such, we would rather stay on the sidelines for now than look for a near term correction.
However, we don’t believe that December marks a tipping point for the outlook for wages. Ongoing strength in female participation will prevent a meaningful fall in the unemployment rate in the first half of 2018 before we see a moderation in employment growth through the second half of the year.
The week that was
It has been another very positive week for Australian economic data, with the labour force survey the highlight. A raft of China data has also come in, further emphasising the strength of their economy in 2017.
The best place to start our discussion is the labour force report. This edition received special attention because a positive employment outcome would mean that the past 15 months would stand as the (equal) longest period of consecutive employment gains in the history of the series. This indeed was the case, with 35k jobs reported in December following November’s outsized 63k gain. For the year as a whole, 400k jobs were created; and, at 3.3%yr, the annual pace was more than twice the current estimate of population growth. Matching underlying growth, increases in employment have been concentrated in the southeast states and in the services sector (particularly health and education).
Intriguingly, despite the strong employment gain, the unemployment rate actually rose in December, from 5.4% to 5.5%; the cause was a 0.2ppt increase in the participation rate. Female participation has been in a strong uptrend since 2013 and stands in stark contrast to male participation, which is little changed over the period. It is logical to conclude that this rise in the supply of workers from outside the labour force has been a significant factor in restraining wage gains – along with industry rotation; soft domestic demand; and global factors such as greater competition and technology. Looking forward, we anticipate a slowing in the pace of employment growth. However, the leading indicators imply momentum will remain robust well into 2018.
Our Westpac-MI consumer sentiment survey was also released this week for January. Being the summer holiday period, confidence is typically overstated, hence we adjust both the headline measure and its components to compensate. After adjustment, January still reported a 1.8% increase in the headline index to 105.1, comfortably above both the series’ long-run average and the 100 optimist/ pessimist divide. Expectations around the economy drove the monthly gain, the ‘economic conditions, next 12 months’ sub-index up 2.6% and ‘economic outlook, next five years’ sub-index surging 5.4%.
Expectations of family finances for the coming year also improved, rising 1.7% to 109.1 – the highest level in over four years. However, compared to a year ago, the majority of households actually felt worse off. Arguably this is why the ‘time to buy a major household item’ sub-index remained well below its longrun average. If consumption growth is to accelerate in 2018 as the RBA anticipate, then we will need to see the strength in employment growth pass through to both family finances (higher wages) and sentiment. We remain doubtful that this will occur in the foreseeable future.
Finally for the domestic economy, housing finance approvals also surprised to the upside in November, the number of approvals to owner occupiers rising 2.1% (2.4% and 9.2%yr excluding refinance) as the value of loans to investors lifted 1.5% (-8.3%yr). This result contrasts with a priori expectations that 2017’s macroprudential policy changes would have a lasting impact on activity – as occurred in 2015. The detail showed that first-home buyers were a key support (4.5%; 36%yr), and unsurprisingly that this strength was concentrated in NSW and Vic – states where first-home buyer activity has been at low levels for a protracted period, and where state governments are offering considerable support. A possible conclusion to draw from this stronger momentum is that foreign buyers – who don’t form part of this survey – may be a greater contributor to the broader housing slowdown than currently perceived.
Moving offshore, this really has been China’s week. The first take home from the array of data released is that China’s economy had a stellar year in 2017. The second is that a slowdown in growth is underway, a consequence of tighter policy. In Q4, annual GDP growth came in at 6.8%yr, unchanged from September and only a tick down from the first half’s 6.9%yr pace. That said, the 1.6% quarterly gain was a step down from the near 1.9% experienced through mid-year. Driving this slowdown has been a material and broad-based deceleration in investment across the economy. Through 2017, growth in fixed asset investment has slowed from 9% to 7%. A base does look to be forming in a number of sectors, including housing construction, but the amplitude of the next upcycle is likely to be muted. This leaves the consumer as the key cyclical driver of growth. While momentum in consumer-related sectors remains robust, it has failed to accelerate further – likely owing to underwhelming gains for employment and incomes, a theme we have highlighted repeatedly as part of our PMI release.
Come 2018, with net exports not expected to contribute as they did in 2017, and given consumption growth is unlikely to accelerate further, we anticipate that growth will slow from 2017’s year-average pace of 6.9% to around 6.2%. That should still be regarded as a robust and sustainable result, one that better fits authorities’ desire for ‘quality growth’. Crucial to the outlook for the consumer and the industrial sector will be credit supply. Authorities took a much tougher stance in this area in 2017, and these restrictions are set to remain in place. The purpose is to remove the risk that speculation and exuberance can create in a developing economy, particularly one that already has a high level of debt. It is for this reason that the central government is also unlikely to replenish its funding to local government authorities to allow stronger public investment in the provinces, and also why future house price and investment gains are likely to be modest compared to history, and skewed to tier 2 and beyond.
New Zealand: week ahead & data wrap
Unhappy new year
Firms have taken a dimmer view of the economy’s prospects in the early part of this year. Some of that can be pinned down to the recent change of government, but not all – there are genuine signs that economic growth has slowed from its previous pace.
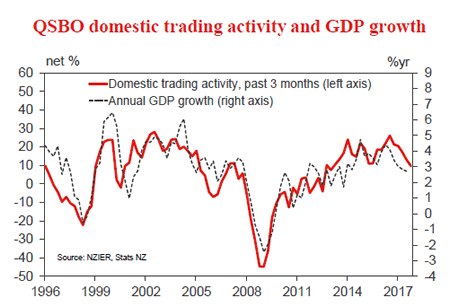
The NZIER Quarterly Survey of Business Opinion found that a net 11% of firms were pessimistic about the general business environment over the coming months, compared to a net 5% who were optimistic in the September quarter survey. Firms’ own reported and expected trading activity, which tends to correspond more closely with GDP, saw more modest declines.
The fall in confidence wasn’t a surprise in itself. Monthly business surveys had already shown a steep drop in confidence in November after the new Labour-led Government was formed, though with some rebound in December after the initial dummyspitting. The drop in confidence in the QSBO wasn’t as dramatic, but it did reach its lowest levels in several years.
It may be tempting to write this off as just a protest vote against the new government, but we don’t think that the results can be so easily dismissed. For one thing, impressions matter for how people act. One of the reasons that we downgraded our near-term growth forecasts last year is that we expect a hiatus in business investment, as firms get to grips with the new government’s policies. The QSBO provides some support for that view: firms’ intentions to invest in plant and machinery fell from 17 to 12, the lowest in two years. Slower investment would lead directly to lower GDP growth in the near term (but would add to concerns about capacity constraints in the longer run).
Another factor is the extent of the decline. We find that general sentiment in the QSBO tends to be around 10 points lower under Labour governments than under National governments, so a 16-point drop is within the range of plausible outcomes. However, there’s no such bias evident in the firms’ own-activity measures, which fell in the latest survey. We’d also point out that business confidence has been falling even since before the election; the cumulative fall has been much greater than we would normally see from a change of government.
So there does seem to be some genuine loss of optimism about the economy as well – at least, compared to the economy’s strong run of growth in previous years. Revisions to the national accounts, published at the end of last year, showed that the economy powered ahead to 4% growth in 2016. But things were relatively more subdued in 2017, with annual growth slowing to around 3% by the September quarter. With population growth still running at around 2% a year, that amounts to a substantial slowing in per-capita terms. The latest QSBO results are in line with our view that growth will continue to slow in the near term. There was another important aspect to the QSBO: it highlighted how far the economy has progressed from the sharp downturn that followed the global financial crisis. Several years of strong GDP growth mean that the economy is now running closer to full capacity again. That is particularly evident in the labour market, with firms reporting that the difficulty of finding skilled workers and employee turnover are at their highest in 12 years.
Consequently, the survey’s measures of average costs and prices have been gradually heading up over the last couple of years. At their current levels, they don’t suggest a risk of inflation challenging the upper end of the Reserve Bank’s inflation target. Rather, they suggest that we may now be past the era of surprisingly and persistently low inflation.
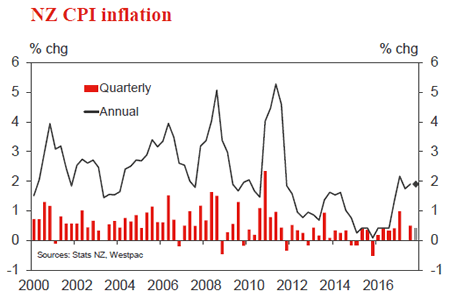
We expect next Thursday’s CPI release to show the annual inflation rate holding at 1.9% in the December quarter, very close to the RBNZ’s target midpoint of 2%. Some of the inflation comes from rises in food and fuel prices that we don’t necessarily think will be sustained in coming years; excluding these items, we expect annual inflation to hold at a more modest 1.6%.
Of course, low interest rates have also been a major part of getting the inflation rate to this point. The OCR cuts in 2015 and 2016 were prompted by the persistent weakness of inflation in recent years, with concerns that this would flow through into people’s perceptions over the longer term. While those interest rate cuts are now doing what they were meant to, we’re not convinced that there is a case for withdrawing them yet. We continue to expect no changes to the cash rate until late 2019.
Data Previews
Aus Dec Westpac-MI Leading Index
Jan 24, Last: +0.69%
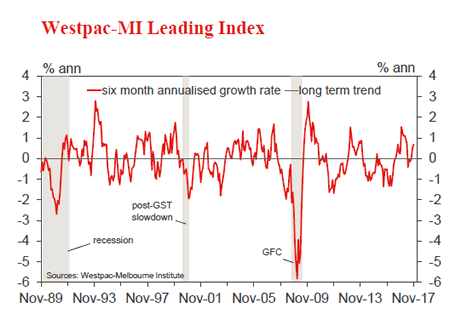
The six month annualised growth rate in the Leading Index lifted from +0.51% in October to +0.69% in November, a strong above trend reading indicating some of the headwinds evident earlier in the year have eased.
The Dec index looks set to record a further lift with several components posting strong gains, most notably dwelling approvals which jumped 10.4% in Nov due to a spike in high rise approvals in Vic. Other components recording improvements include: the ASX200, up 1.6%; the Westpac- MI Consumer Expectations Index, up 3.1%; US industrial production, up 0.9%; commodity prices, up 3.7% (in AUD terms); and the Westpac-MI Unemployment Expectations Index.
NZ Q4 CPI
Jan 25, Last: 0.5%, Westpac f/c: 0.4%, Mkt f/c: 0.4%
We estimate that consumer prices rose by 0.4% in the December quarter, led by higher fuel prices and other transport costs. This would keep the annual inflation rate at 1.9%, very near the 2% midpoint of the Reserve Bank’s target range. Excluding the volatile food and fuel categories, we expect annual inflation to remain at a more modest 1.6%.
Our forecast is slightly higher than the Reserve Bank’s pick of 0.3% for the quarter, although the difference is in the more persistent non-tradable categories where an upside surprise would be more significant.
The December quarter release will incorporate Stat NZ’s three-yearly reweighting of the basket of goods and services that make up the CPI. However, the new weights have had very little impact on our inflation forecast.
Eur ECB policy meeting
Jan 25, deposit rate Last -0.40%, WBC -0.40%
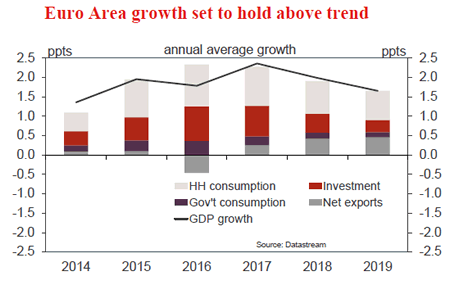
The December meeting minutes heightened expectations of a coming shift in the Council’s forward guidance.
Therein, the Council highlighted that growth in the region was "increasingly self-sustaining" and that the output gap was expected to close soon. The consequence for inflation is an erosion of remaining downside risks and greater belief that it will reach their 2.0%yr target in the ‘medium term’.
We and the market do not expect a near-term change in the stance of policy. Instead, the debate is over whether the asset purchase program can end at September, or will need to be run down over the remainder of the year. From there, the key question is how far into 2019 it will be before a rate hike is delivered. A definitive view wont be available for months, but that wont stop the market from extrapolating any change in tone in the interim – however minor.
US Q4 GDP
Jan 26, Last 3.2% annualised, WBC 3.3% annualised
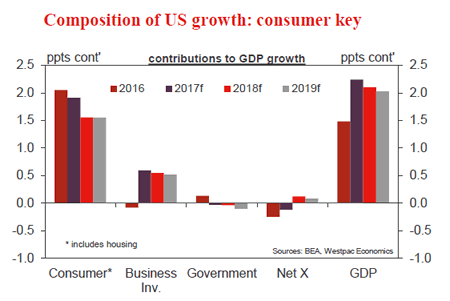
Following a slow start to 2017, activity growth accelerated to above 3% in Q2, a pace it has since sustained. Q4 is unlikely to challenge this ‘trend’, with a 3.3% gain anticipated.
Consumption growth will be a key support in Q4 thanks to strength in durables spending as well as robust momentum for services. After two negative quarters, residential investment should also aid GDP in Q4.
Business investment has certainly improved through 2017; but circa 5%, the annual pace is still modest versus history. A similar gain is expected in the final 3 months of 2017.
Inventories and net exports are wild cards quarter to quarter. In this instance, the risks are likely offsetting.
