Gold has finally broken 1260.00 long-term support in early Europe as the gold/silver (mint) ratio hits new highs suggesting a much more substantial down move could now occur.
GOLD
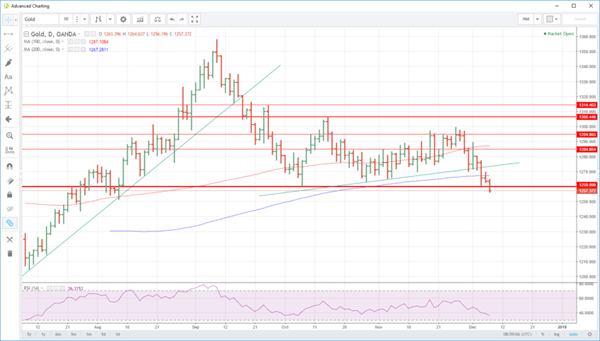
Gold attempted a comeback rally after Tuesday’s calamitous sell-off, but it was quickly snuffed out and failed ahead of 1270.00. Instead, the yellow metal ended the day with a whimper, closing near its lows at 1263.70 and appearing to be preparing itself for a severe test of critical long-term support. Gold traders will face a nervous end to the week as gold fails to rally even as the U.S. yield curve continues to flatten and ahead of crucial payroll data tomorrow evening.
With Asian shares solidly in the red and a general risk-off mood permeating the markets, it is significant that gold cannot find any support. The safe-haven bid that would typically appear in times such as these has disappeared from the market’s thoughts. It is yet another black market against the yellow metal.
Gold has now closed two days in a row under its 200-day moving average at 1267.30 and now intra-day resistance. This is followed by 1270.00 and then 1273.30.
The downside looks far more ominous, with gold breaking the critical long-term support at 1260.00 in early Europe, trading to a low of 1256.00 as stop losses set in. We have had a small rebound to 1259.00 but have been unable to recapture 1260.00. A daily close below this level could set of structural unwinding of long positioning, and the technical picture shows no meaningful support for gold until the 1200.00 regions.
While it is still too soon to suggest a significant sell-off is on the cards, the charts do imply that gold may well be about to break out of its three-month trading range.
Silver
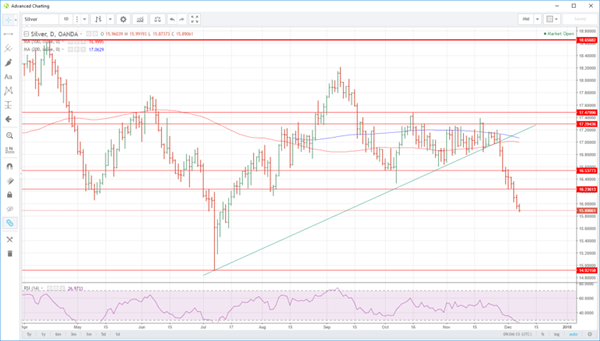
Silver has led gold lower over the last week. The break of its five-month trendline support at 17.0000 also took out it’s 100 and 200-day moving averages. Silver has since plunged over the past week to the 15.8900 lows we have seen today. Resistance is at 16.2360 and 16.5380, but the charts have no meaningful support until 14.9200, still another dollar away.
Temporary salvation may be at hand though. The daily Relative Strength Index (RSI) is now at very oversold levels. This is an excellent short-term indicator when used with precious metals and commodities. It suggests that Silver may have done enough for now and that a bounce could be on the cards in the short-term at least
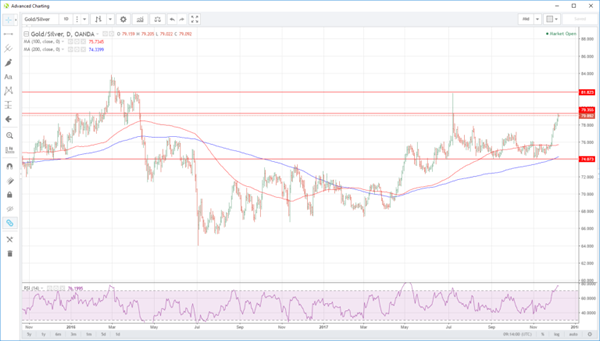
Gold/Silver (Mint) Ratio
The mint ratio has hit six-month highs overnight, moving to the 79.00 regions. Traders should note that the ratio’s daily RSI is at extreme overbought levels. This implies that either silver is hugely oversold (see above), or that gold is not yet at fair values, ie overbought versus silver. (see gold above)
Whichever way you chose to cut it, the mint ratio and its RSI are telling us that that gold could go lower and or that silver should remain unchanged or move higher.
The mint ratio also has interim resistance just above at 79.35 will strong resistance at 81.80. Support is at 75.75 and then 74.00 which is a massive level, being multiple daily lows over the last six months.
The fact that support is so far away as compared to resistances again reinforces the case that the mint ratio could be signalling more downside for gold.