Key Highlights
- The New Zealand Dollar recently fell below the 0.6900-0.6880 support area against the US Dollar.
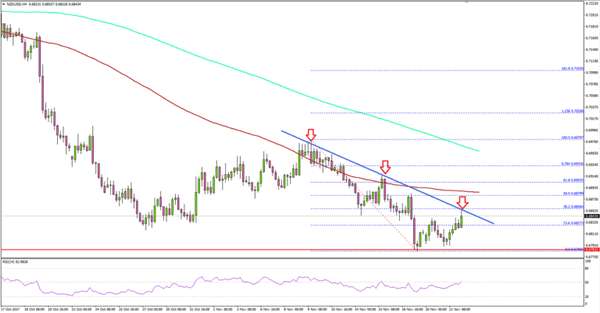
- There is a crucial bearish trend line forming with resistance at 0.6850 on the 4-hours chart of NZD/USD.
- New Zealand’s Visitor Arrivals in Oct 2017 increased by 3.9% (YoY), more than the last +3.1%.
- The US Existing Home Sales in Oct 2017 increased 2% (MoM), more than the forecast of +0.7%.
NZDUSD Technical Analysis
The New Zealand Dollar remains in a major downtrend below 0.6900 against the US Dollar. The NZD/USD pair is holding the 0.6780 support, but remains at risk of more declines.

The pair is currently well below 0.6880, 100 simple moving average (red, 4-hour) and the 200 simple moving average (green, 4-hour). On the upside, there is a crucial bearish trend line forming with resistance at 0.6850 on the 4-hours chart.
Above the trend line resistance, the 50% Fib retracement level of the last decline from the 0.6979 high to 0.6780 low is at 0.6879 to act as a major resistance along with the 100 simple moving average (red, 4-hour).
On the downside, the recent low at 0.6780 low is a decent support. A break of the stated support at 0.6780 could ignite further declines toward 0.6750 and 0.6720.
US Existing Home Sales
Recently in the US, the Existing Home Sales figures were released by the National Association of Realtors. The forecast was slated for a rise of 0.7% in the Existing Home Sales compared with the previous month.
However, the actual result was better as there was an increase of 2% in sales in Oct 2017. On the other hand, the last reading was revised down from +0.7% to +0.4%.
Commenting on the report the NAR chief economist, Lawrence Yun stated:
Job growth in most of the country continues to carry on at a robust level and is starting to slowly push up wages, which is in turn giving households added assurance that now is a good time to buy a home.
Overall, the NZD/USD pair remains in the bearish zone as long as it is below 0.6850.
Economic Releases to Watch Today
US Initial Jobless Claims – Forecast 240K, versus 249K previous.
US Durable Goods Orders for Oct 2017 – Forecast +0.3% versus +2.2% previous.
