Key Highlights
- Crude oil price recently traded as high as $57.84 against the US dollar before starting a downside correction.
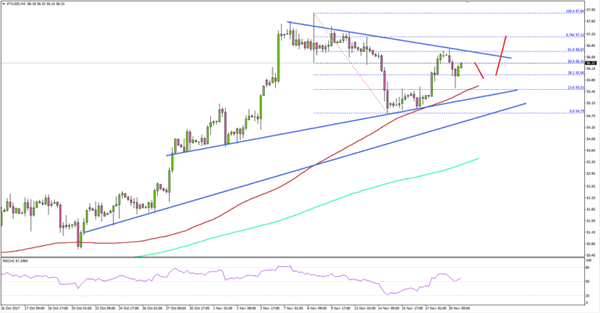
- There are two bullish trend lines forming with supports at $55.50 and $55.00 on the 4-hours chart of XTI/USD.
- The 100 simple moving average (red, 4-hour) is also positioned at $55.50 to provide support.
- Today, the US Existing Home Sales Change will be released for Oct 2017 which is forecasted to increase by 0.7% (MoM).
Crude Oil Price Technical Analysis
Crude oil price traded nicely in November 2017 so far and recently traded as high as $57.84 against the US dollar. It is currently correcting lower but remains supported above $55.00.

The price recently traded towards the $55.00 support area where the 100 simple moving average (red, 4-hour) prevented declines. Looking at the 4-hours chart of XTI/USD, there are two bullish trend lines in place with supports at $55.50 and $55.00.
On the upside, there is a connecting bearish trend line with current resistance at $56.60 on the same chart. Should there be a close above $56.60, the price will most likely retest $57.80.
On the downside, only a close below $55.00 and the mentioned 100 simple moving average could open the doors for losses may be toward $54.00 or even $52.00. An intermediate support is around $53.30 and the 200 simple moving average (green, 4-hour).
Economic Releases to Watch Today
UK’s Public Sector Net Borrowing Oct 2017 – Forecast £6.600B, versus £5.326B previous.
US Existing Home Sales for Oct 2017 (MoM) – Forecast +0.7%, versus +0.7% previous.
