Week beginning 20 November 2017
- Australian dollar weakens further on narrowing AUS/US rates differential.
- RBA Governor Lowe speaking at ABE annual dinner, RBA Minutes.
- Australia: Westpac MI Leading index, construction work.
- NZ: retail sales and trade balance.
- Euro Area: ECB President Draghi speaks, ECB minutes.
- US: Fed Chair Yellen speaks, FOMC minutes, Thanksgiving.
- Markit flash PMIs.
- Key economic & financial forecasts.
Information contained in this report was current as at 17 November 2017.
Australian Dollar Weakens Further on Narrowing Aus/US Rates Differential
Since mid October the Australian dollar has softened from around USD 0.7825 to USD 0.76. That is in line with our targeted 2017 year end level of USD 0.76. We confirm our forecast that AUD will drift even lower in 2018 ending that year at around USD 0.70.
Readers will be aware that one core driver of this deteriorating outlook for the AUD is our expectation that the overnight yield differential between Australia and the US will narrow significantly. Our target has been that by end 2018 the RBA overnight cash rate will be 38bps below the US federal funds rate.
Further, the yield differential between Australian and US 10 year bonds will collapse to zero by end 2018.
Those dynamics are now well underway.
Back in September, markets assessed the differential between the RBA overnight cash rate and the federal funds rate by end 2018 as around 40bps, a long way from our forecast of minus 38bps.
But in recent weeks that expected margin has narrowed close to zero, still a long way from our target of minus 38bps but a very substantial move in the right direction.
Equally, the spread between the Australian 10 year bond rate and the US 10 year bond rate has contracted from 55bps on September 15 to around 23bps today.
The market’s lowering of expectations for RBA hikes and relative bullish sentiment towards Australian bonds is an appropriate response to the run of recent information.
Following the below consensus Q3 CPI print of 0.6% for headline inflation and 0.35% for the core average, the ABS released the CPI reweight. Incorporating the changed weights, we struggle to see a peak in headline inflation any higher than 2.0%yr for the foreseeable future.
That belief proved to be shared by the RBA, as the November Statement on Monetary policy saw significant changes to the policy sensitive inflation outlook. Underlying inflation is now forecast at 1 ¾% for 2017; 1 ¾% for 2018; and 2% for 2019. The August forecasts had underlying inflation at 1½% – 2½% in 2017; 1½% – 2½% in 2018 and 2% – 3% in 2019.
It is our view that the decision to lower the forecasts to below the bottom of the band in 2018 and at the bottom of the band in 2019 has significant policy implications. We are now assessing a central bank which is expecting that it will undershoot its core inflation target for another year, and that, even one year out, inflation will still be at the bottom of the target zone.
We are not changing our view that rates in Australia will remain on hold in 2018 and 2019, but we have always been uncomfortable that the central bank’s forecasts were implying that it was expecting it would be raising rates in 2018. These forecasts no longer portray a central bank that expects to raise rates.
In addition to the benign inflationary environment, retail sales data showed volumes up only 0.1% in Q3. This highlights downside risk to the consumption figures in the upcoming GDP release for the September quarter.
Earlier this week, the November Westpac-MI Consumer Sentiment survey fell to 99.7 from 101.4 in October. The detail cast further doubt on the consumption outlook for Q4.
Responses to our annual question on Christmas spending plans point to moderate activity. Just under a third of Australians expect to spend less on gifts this year than last, with 54% expecting to spend about the same and just 11% spending more – the lowest proportion since we began running this question in 2009. Overall the net balance of ‘more minus less’ is marginally more negative than last year, suggesting we’re in for a repeat of last year’s lacklustre Christmas spend. The state responses show consumers in Victoria and NSW are a little less inclined to restrain spending while those in SA and WA are tilting more towards cutting back.
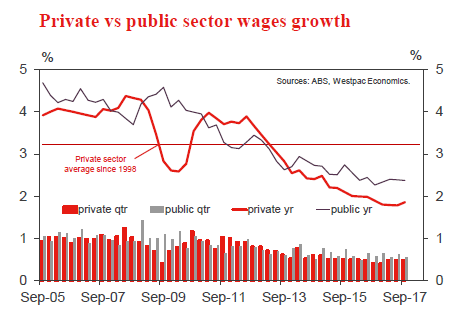
It is no surprise that consumers are thinking about reducing spending given their very subdued income growth. This week’s Q3 WPI data indicated that wages growth is tracking at 2.0%yr, remaining near historic lows. That was despite the Fair Work Commission’s annual wage review decision to increase the minimum wage by an above normal 3.3%. Given last year’s minimum wage rise was 2.4%, expectations were for an uplift in quarterly wages growth to 0.7%. However, the actual result came in at 0.5% reflecting softness in wages growth across the broader labour market.
Persistently low income growth is a constraint on consumer spending, particularly given the high level of household debt.
As a country that runs significant current account deficits and high associated foreign liabilities, Australia needs to offer attractive yields in order to fund these liabilities in a world where Australia’s assessed risks are not reducing. As we have discussed previously, Australia’s housing markets are deteriorating. In the main market, Sydney, house price momentum (6 month annualised) has slowed from 20% in January this year to -0.5% in October.
We are also seeing disturbing headwinds around regulation; taxes; and bank interest rates unnerve investors. This group still explains the dominant component of new lending for housing but in September, we saw a sharp 6.3% fall in lending to investors.
Australia’s reliance on foreign investors to fund our large accumulated overseas debt is dependent on offering an attractive yield or a cheaper currency. These factors will be exacerbated if there is some waning in investor confidence. Our housing markets attract relentless scrutiny from foreign investors. Recent developments in the housing market and the near term risks are unlikely to go unnoticed.
The last time Australian rates fell below US rates was in the June 1999 – December 2000 period. The yield differential ranged from minus 25bps to minus 50bps. The AUD entered that period at around USD 0.66 and gradually fell, settling at USD 0.50.
We certainly expect that the targeted yield differential by end 2018 of minus 38bps can be sustained well into 2020 as we expect the overnight cash rate to remain on hold in 2019 as well. There is some consolation in the spread, in that the Federal Funds rate is also expected to remain steady in 2019. This sustained period of a negative interest rate differential is expected to take its toll on the AUD. By mid 2019 we are looking for the AUD to move down to USD 0.68 with the risks pitched to the downside.
Currencies are not only affected by interest rate differentials and confidence. For Australia, commodity prices and the ongoing current account deficit are also important.
Back in 1999-2000, Australia’s current account deficit was averaging around 5% of GDP. We expect that over the next two years this deficit will average nearer 2.5% of GDP, thanks of course to China’s industrialisation miracle. Australia’s terms of trade are around 55% higher now than we saw during that last period of negative interest rate differentials.
Overall around a cumulative US10¢ fall in the AUD is expected. We are not expecting the precipitous US16¢ fall we saw in 1999 and 2000.
The Week that Was
The past week has had a focus on confidence and the labour market for Australia. Offshore, US retail and CPI inflation came in line with expectations, but German GDP caught the market off guard.
While confidence was unaffected, business conditions (as reported by the NAB business survey) surged in October to +21, a new all-time high. The gain was highly concentrated by sector (in manufacturing) and by state (in NSW); hence, the result is likely at least partly noise. It remains our belief that the NAB survey overstates current conditions, in part owing to the exiting of uncompetitive firms in some sectors, such as the auto industry. Regardless, the survey continues to provide very helpful guidance on the mix of conditions across the economy (manufacturing and construction strong; consumer-centric sectors weak) as well as the state of the labour market. For employment, the NAB survey suggests that the current strong pace of gains will persist into year end. This is consistent with the October labour force release, see below.
Given the mood of retailers, it is not surprising that after October’s ‘return to optimism’ (a reading of 101.4), Westpac- MI Consumer Sentiment again succumbed in November, falling back to 99.7 – below the 100 optimist/pessimist divide. Whereas concerns over family finances have typically driven declines in confidence over the past year, in this instance it was renewed concern over the economic outlook. The ‘economic conditions, next 12 months’ index largely unwound last month’s bounce, falling 6.2%; meanwhile, the five-year outlook fell 2.2%. Both of these sub-components are likely to have been affected by political uncertainty over the ‘citizenship’ saga.
On consumer spending, it remains the case that lingering concerns over family finances are restricting demand. Perceptions of family finances did improve in the month, but they remain at below average levels despite continued strength in employment growth and a favourable mood amongst households towards the labour market overall. Having fallen back in November, ‘time to buy a major household item’ is currently 7% below average. Each year, our November survey also provides colour on households’ Christmas spending plans. In 2017, spending plans are downbeat, with just under a third of consumers expecting to spend less than last year, and 54% the same; only 11% plan to spend more than last year. The overall result is marginally down on last year, implying a repeat of 2016’s lacklustre sales. On housing, the ‘time to buy a dwelling’ series did rise 3.4% in the month, but still stands 18% below average. Interestingly, in November, NSW improved as Victoria deteriorated; this follows an easing in house price growth in NSW as price gains held up in Victoria. Household’s views on the housing market are clearly being affected by perceptions of affordability and competition.
One of the persistent concerns for households is weak wages growth and the Q3 wage price index indicated a continuation of subdued growth. See chart of the week below for further detail.
The enduring weakness in wages remains a stark contrast to employment growth as per the labour force survey. October only saw a net gain of 3.7k jobs. However, that came as a result of a 24.3k increase in full-time employment, and saw the annual pace of total employment growth sustained at 3.0%. At nearly twice the pace of population growth, employment growth is unquestionably strong. As we have highlighted on a number of occasions, there are two factors behind the great divide between employment growth and wages: (1) the jobs that are being created are typically lower-paid positions, an outright negative for growth in average incomes across the population; and (2) while the unemployment rate is less than half a percentage point from its full employment level, the rate of underemployment has continued to trend higher over the past three years and is presently near its historic high. Broadly, the supply of potential workers is plentiful; hence, there is no meaningful pressure on wages growth.
Switching to the global economy, little new information came to hand this week. Debate over tax reform has been continuing in both the House and Senate, and the House passed their version overnight. However, the Senate is still discussing its own version of reform, and won’t vote on it until after Thanksgiving. After that, the discussions on a compromise bill will begin, which is the hard part. It will likely be some time before their similar-but-different plans on tax reform become a unified bill that can be put to a final vote.
On the data front, retail sales and the CPI were both broadly as expected and of little significance for policy. But September quarter GDP growth caught the market’s attention, particularly the ongoing acceleration in the pace of growth in Germany. While this may see more disquiet amongst German authorities over the stance of Euro Area policy, the reality is that the growth and labour market outlook for the Continent as a whole are a long way from justifying higher inflation and tighter policy expectations. For further details on growth across the region and the outlook, see this week’s Northern Exposure.
Chart of the week: Q3 Wage Price Index
One of the persistent concerns for households is weak wages growth. We, the market and the RBA were anticipating a reprieve in the September quarter, with the wage price index expected to gain 0.7% – supported by a known 3.3%yr rise in the minimum wage effective 1 July.
Despite this positive impetus, the wage price index disappointed materially, coming in at just 0.5% in Q3 and 2.0%yr. We estimate that, abstracting from the minimum wage effect, underlying wage growth in Q3 was likely around 0.3% – a very weak outcome. The weakness in wages remains broad based, with private wages up 1.9%yr and the public sector 2.4%yr. Within the private sector: the strongest performing industries were arts & recreation and health care & social assistance (both up 2.7%yr), while mining continued to see the slowest wage growth, circa 1.2%yr. All of these outcomes are soft versus history, and would have come as a significant surprise to the RBA.

New Zealand: Week Ahead & Data Wrap
Brave new-ish world for monetary policy
For nearly 30 years now, New Zealand monetary policy has been squarely focused on ensuring price stability. What this has meant in terms of a precise inflation target has been tweaked a little over time. In addition, successive updates to the Policy Targets Agreement (PTA) have directed the RBNZ to also consider factors such as asset prices and volatility in the exchange rate in its pursuit of price stability. But despite such changes, the core of the monetary policy framework has essentially remained intact since its inception.
However, over the coming months we’re likely to see a large shake-up in the framework. The Labour-led coalition Government has signalled that it intends to expand the RBNZ’s mandate to include a focus on maximising employment as well as price stability. There’s also likely to be a change in the decision making structure at the RBNZ, with a shift away from the current single decision maker model to a committee structure.
With regards to the decision making structure, the proposed shift to a committee doesn’t imply a big change to how the RBNZ sets policy. The RBNZ already uses a committee structure for some of its internal policy deliberations, and it includes a number of external advisers. Importantly, this change on its own doesn’t imply a shift in the RBNZ’s thinking with regards to the balance between activity and inflation.
In contrast, the shift to a dual mandate could have larger implications for the stance of policy. Recent media comments from the Minister of Finance indicate that the Government wants the RBNZ to place more emphasis on the state of the labour market than it has in the past. In addition, a new Governor will step into the ring in March, and the Finance Minister has signalled that he favours the appointment of someone who will follow the spirit of the coming changes to the RBNZ’s mandate (the actual selection of Governors is made by the RBNZ’s Board, but must be approved by the Minister).
The key question is whether adding the goal of ‘maximising employment’ will materially affect the RBNZ’s behaviour? Not necessarily. The RBNZ has always been conscious of how its decisions will affect the real economy, including the potential impacts on the labour market and unemployment. In addition, the Government has indicated that it will not set a numerical target for ‘maximum employment’, or direct the RBNZ how to act when the two goals appear to conflict. Such a specification, along the lines of the dual mandates of the US Federal Reserve and the Reserve Bank of Australia, might prove to be fairly benign.
However, a key concern with a ‘maximum employment’ goal is that it’s not symmetric. We doubt it would have prompted the RBNZ to act any differently in recent years, when both inflation and unemployment pointed in the direction of keeping interest rates low. But the acid test would come when the economy is running hot and unemployment is below its long-run sustainable rate (which the RBNZ puts somewhere around 4 to 5%). Keeping inflation on target at these sorts of times would argue for higher interest rates. That would cause a rise in unemployment, putting the two goals in conflict.
If the employment mandate caused the RBNZ to become quicker to cut interest rates and slower to raise them, the consequence would be higher inflation over time. That could actually be detrimental for growth over an extended period. It is possible for monetary policy to generate temporary increases in employment growth. However, it’s not possible to run loose monetary policy indefinitely to boost employment growth or keep the unemployment rate artificially low. Attempting to do so ultimately just leads to higher inflation, but not higher employment, as the resulting increases in costs gradually erode the strength of economic activity. That’s essentially what we saw around the globe over the 1960s and 1970s.
International and domestic experience has shown that the biggest contribution that monetary policy can make to the economic landscape is ensuring stability in prices. This helps to avoid large swings – up or down – in activity. And over time, this helps to support ongoing, sustainable gains in employment. This is the approach that has been in use in New Zealand for some time.
Housing conditions to remain subdued for an extended period
On the New Zealand data front, the main news over the past week was the release of the REINZ house sales figures for October. Recent weeks have seen some easing in mortgage rates, which has given the housing market a bit of a boost. We’ve seen this most clearly in Auckland, where house prices have been creeping higher again after moderating in the early part of the year. And we could see this continue for while a while yet.
But despite the recent pick up, New Zealand’s housing market is still looking a lot softer than it did this time last year. Sales are down 15% since last October. At the same time, the double digit house price growth we saw in previous years has given way to a period of quite subdued gains. A range of factors has contributed to this slowdown. This includes the creep higher in mortgage rates in late 2016 and early 2017, as well as the tightening in lending restrictions by the RBNZ. Pre-election uncertainty also appears to have had a dampening impact.
We think the New Zealand economy is in for an extended period of weak house price inflation. The new Government is planning on rolling out a suite of regulatory changes over the coming years that will dampen housing market conditions. First off the block will be a ban on non-resident buyers of existing properties. The ‘bright line’ test for taxing capital gains on investment properties will also be extended from a two-year minimum holding period to five years. Such changes will be reinforced by tighter migration settings that will reduce the rate of growth in demand for housing. Longer-term, the new government has signalled that it will also remove negative gearing (the ability to use losses on rental properties to offset taxable income from elsewhere). Finally, the Government plans to review New Zealand’s tax base, which could see further changes to the tax treatment of capital gains from housing.
Data Previews
Aus Oct Westpac-MI Leading Index
Nov 22, Last: -0.2%
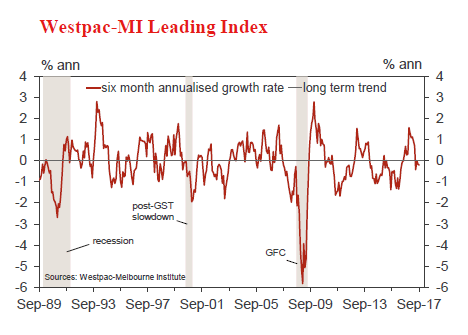
- The Leading Index has swung sharply in recent months from well above trend to back below trend, the six month annualised growth rate holding at 0.2% below trend in Sep. The turnaround mainly reflects swings in Australia’s commodity prices and to a lesser extent a shift to a rising yield curve implying tightening financial conditions.
- The Oct read will include updates on the ASX200 which surged strongly, up 4%. Other components have been mixed. On the negative side, consumer sentiment based measures deteriorated slightly and commodity prices were down 0.9% in AUD terms. On the plus side, dwelling approvals rose 1.8%; the yield spread widened slightly; and total hours worked continued to tick over. The six month growth rate may pick up given earlier weakness is starting to drop out of the picture.

Aus Q3 construction work
Nov 22, Last: 9.3%, WBC f/c: -2.7%
Mkt f/c: -2.3%, Range: -7.5% to 24.0%
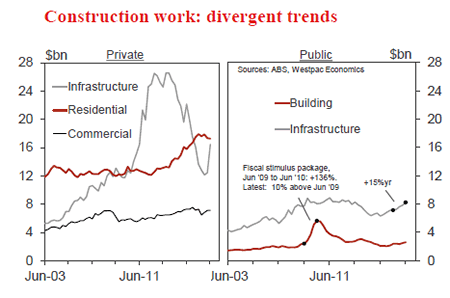
- Currently, the Construction Work survey is an unreliable partial indicator for the National Accounts. Recently, LNG platforms have been imported. The survey includes the full value of the platform when it is imported, rather than actual work in the period, as in the national accounts.
- In Q2, ‘construction work’ reportedly spiked, +9.3%, boosted by imported platforms (which is included in private infrastructure). For Q3, with fewer platforms imported (1 rather than 2), we expect a partial reversal, -2.7%. We caution, there is a high degree of uncertainty around this forecast – the value of these platforms is unclear, due to commercial in confidence.
- Turning to private building and public works, activity in these areas grew by 1.2% in Q2 and we anticipate a further 1.5% increase in Q3, with broad based strength, across residential, commercial building and public construction.

NZ Q3 real retail sales
Nov 23, Last: +1.7%, Westpac f/c: +0.3%, Mkt f/c: 0.1%
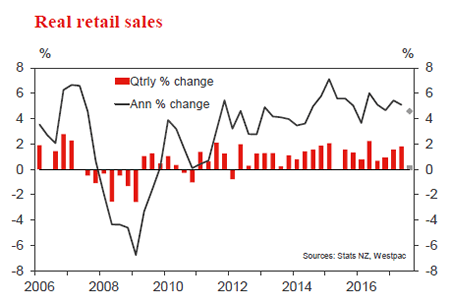
- Retail spending powered ahead in the June quarter, boosted by some high profile sporting events – the World Masters Games and the Lions rugby tour. These events, and the associated strength in tourism inflows, saw strong spending in the hospitality sector. The June quarter also saw spending gains in areas such as building supplies and electronics.
- As we’ve moved into the second half of the year, the momentum in retail spending appears to have faded. A key reason for this is the slowdown in the housing market, which has dampened spending on durable items like household furnishing. We expect only a 0.3% gain in retail volumes in the September quarter. That would be the slowest growth we’ve seen since 2015.

