Key Highlights
- The US Dollar started a new downside wave from the 114.70 swing high against the Japanese Yen.
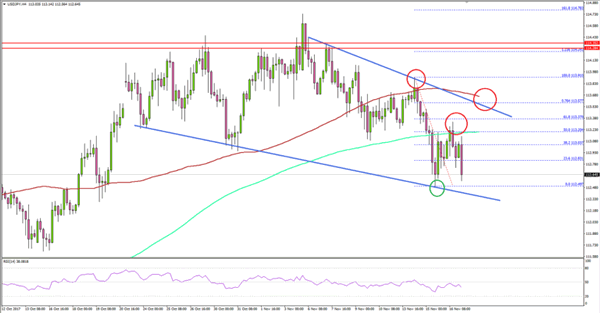
- There is a key contracting triangle forming with resistance at 113.50 on the 4-hours chart of USD/JPY.
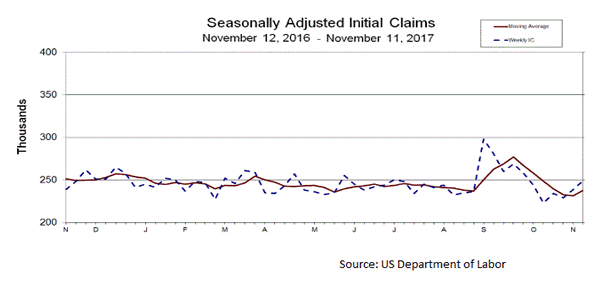
- The US Initial Jobless Claims for the week ending Nov 11, 2017 posted a rise from 239K to 249K.
- Today in the US, the Building Permits figure for Oct 2017 will be released which is forecasted to register a change of +2.0%.
USDJPY Technical Analysis
The US Dollar is in a slow and steady downtrend below 113.50 against the Japanese Yen. The USD/JPY pair is likely to remain under pressure as long as it is below 113.50.

Looking at the 4-hours chart, there was a sharp decline from 113.90 to 112.49. Later, the pair started an upside correction, but it faced resistance near the 50% Fib retracement level of the last decline from 113.90 to 112.49.
It seems like there is a key contracting triangle forming with resistance at 113.50. Above the triangle resistance, the 100 simple moving average (red, 4-hour) is positioned at 113.65.
Therefore, the 113.50 and 113.65 levels are important resistances for an upside move in USD/JPY. As long as the pair is below 113.50, it remains at a risk of a downside reaction toward 112.50 or lower.
US Initial Jobless Claims
Recently in the US, the Initial Jobless Claims figure for the week ending Nov 11, 2017 was released by the US Department of Labor. The forecast was slated for a decrease from the last reading of 239K to 235K.
However, the actual result was on the lower side as there was an increase in claims from 239K to 249K. With this, the 4-week moving average now stands at 237,750, which is 6,500 more than the last 231,250.

The report added:
The advance number for seasonally adjusted insured unemployment during the week ending November 4 was 1,860,000, a decrease of 44,000 from the previous week’s revised level. This is the lowest level for insured unemployment since December 29, 1973 when it was 1,805,000.
Overall, the USD/JPY pair will most likely remain in the bearish zone as long as the 113.50 resistance is intact in the near term.
Economic Releases to Watch Today
Euro Zone Current Account for Sep 2017 – Forecast €30.2B versus €33.3B previous.
US Housing Starts Oct 2017 (MoM) – Forecast 1.185M, versus 1.127M previous.
US Building Permits Oct 2017 (MoM) – Forecast 1.247M, versus 1.215M previous.
Canadian Consumer Price Index Oct 2017 (MoM) – Forecast +0.1%, versus +0.2% previous.
Canadian Consumer Price Index Oct 2017 (YoY) – Forecast +1.4%, versus +1.6% previous.
