Summary
- The FOMC started its nascent easing cycle with a bang, opting to reduce the fed funds target range by 50 bps to 4.75%-5.00% at its last meeting on September 18. But further policy easing seems set to proceed at a slower pace. We look for the FOMC to reduce the fed funds rate by 25 bps at its upcoming meeting on November 7.
- Since the Committee last met, U.S. economic activity has generally surprised to the upside and suggested ongoing resilience. Concerns about rapid softening in the labor market were allayed by the September jobs report showing a much stronger pace of hiring the past three months and the unemployment rate falling to a four-month low. Solid retail sales and upward revisions to income suggest consumer spending remains on a firm footing. Consumer price inflation also came in a bit stronger than expected in September.
- The FOMC’s September dot plot, the recent string of stronger-than-expected data and policymakers’ comments give no reason to expect another 50 bps cut at the Committee’s upcoming meeting. We expect the FOMC will continue to reduce its policy rate with a smaller 25 bps cut as the real fed funds rate remains elevated relative to the past expansion and Committee members’ estimates of “neutral.” Therefore, there seems to remain scope to “recalibrate” policy further to avoid the labor market cooling beyond the point of comfort without rekindling inflation.
- Yet given the recent run of data along with some officials’ prior reluctance to cut much further, if at all, this year, we would not be surprised to see another dissent at the November 7 meeting, and view the risks to our expectation for a 25 bps cut skewed toward the FOMC leaving rates unchanged rather than opting for another 50 bps cut.
- Recent signs of funding pressures lead us to expect the FOMC will discuss the current pace of quantitative tightening (QT) at its November meeting. The secured overnight financing rate (SOFR) traded above the top end of the fed funds target range at the end of Q3, suggesting bank liquidity has become less ample. While we do not anticipate any changes to QT at this meeting, the recent stress will likely lead to an in-depth discussion about the timeline for the cessation of balance sheet runoff. We currently expect QT to cease at the end of Q1-2025.
Easing to Proceed, But at a Slower Pace
The Federal Open Market Committee (FOMC) maintained its target range for the federal funds rate at 5.25%-5.50% for more than a year (July 2023 to September 2024). Although the Committee judged that further rate hikes after last July were not warranted, it opted not to ease policy during that period due to the “elevated” nature of consumer price inflation. However, the Committee decided to slash rates by 50 bps on September 18 because the risks to the Fed’s dual mandate of “price stability” and “full employment” were “roughly in balance.”
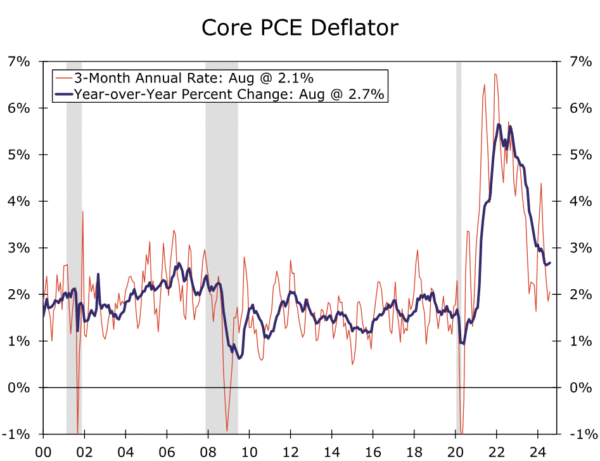
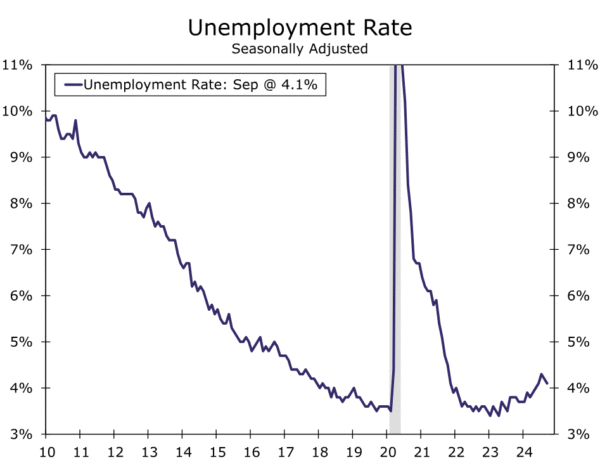
Specifically, the year-over-year rate of “core” PCE inflation, which most Fed officials consider to be the best measure of underlying consumer price inflation, had receded significantly from its peak of 5.6% in February 2022 to 2.6% in July, the last data point the FOMC had when it met on September 18. Moreover, the 3-month annualized rate of change of core prices had receded to only 1.9% in July (Figure 1). On the other side of its dual mandate, the labor market was showing signs of softening. Nonfarm payrolls rose less than expected in August and the prior two months’ gains were revised down by a combined 86K jobs, reducing the three-month average pace of hiring to 116K from 177K at the time of the July FOMC meeting. The unemployment rate, which had been 3.4% in April 2023, had trended up to 4.2% in August (Figure 2). As Chair Jerome Powell said in his Jackson Hole speech in late August, the FOMC did not “seek or welcome further cooling in labor market conditions.”
Fast forward six weeks. Incoming data show that the U.S. economy remains remarkably resilient. Nonfarm payrolls rose by an eye-popping 254K in September, employment gains during the previous two months were revised up by a combined 72K and the jobless rate edged down to 4.1%. The core Consumer Price Index, which is a different measure of consumer price inflation than core PCE inflation but which is highly correlated with it, rose a bit more than expected in September relative to the prior month with a 0.3% gain. Retail spending in September was significantly stronger than most analysts had expected. Upward revisions to income growth over the past year also suggest the U.S. consumer is on sturdier footing, having saved a higher share of income over the past year than previously reported. We estimate that real GDP grew at an annualized rate in excess of 3.0% in Q3-2024 on a sequential basis. In short, the U.S. economy is hardly falling apart at present.
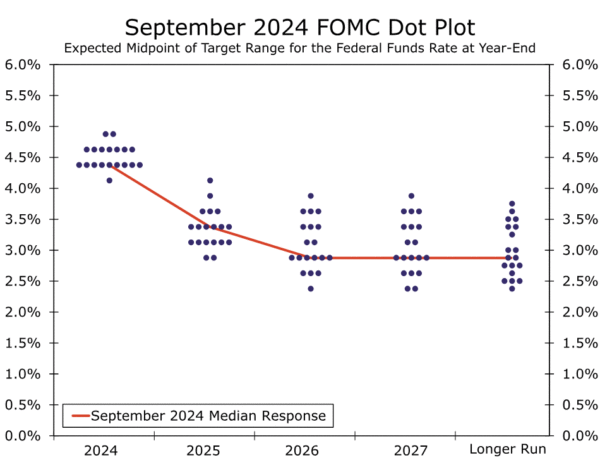
The string of data suggesting that the economy continues to expand at a robust pace and that the labor market is not unraveling have raised questions about whether the FOMC needs to cut again at its upcoming meeting. At its prior meeting in September, nearly half of FOMC participants were already of the view that it would be appropriate to reduce the Fed funds rate by only 25 bps, if at all, through the remainder of this year (Figure 3). While some FOMC members may not be on board with a further rate reduction at the November 7 meeting in light of the recent strength in activity, we believe the bulk of the Committee will want to ease policy further. That said, there seems to be little appetite among FOMC members to follow the 50 bps rate cut on September 18 with a similar-sized reduction in the target range for the federal funds rate at the upcoming policy meeting. Therefore, we look for a 25 bps rate cut on November 7.
We would not be surprised to see another dissent, however, in the form of a voter or two preferring a slower approach to policy easing. Therefore, the risks to our expectation for a 25 bps cut appear titled toward the Committee deciding to keep the target range unchanged, rather than opting for another super-sized move. Financial markets look to be in agreement. As of this writing, pricing in the bond market implies a 95% probability of a 25 bps cut rate cut on November 7.
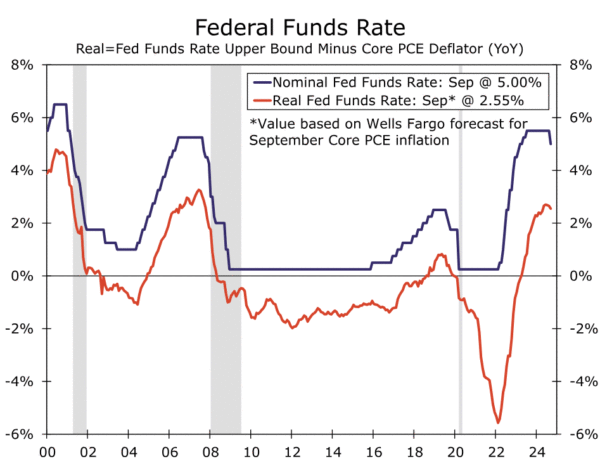
Why cut rates at all at the upcoming meeting? With the fed funds rate currently trading at 4.83% and with core PCE inflation running at a year-over-year rate of 2.7%, the “real” fed funds rate is roughly 2.1% at present. In contrast, the real fed funds rate never exceeded 1% during the economic expansion of 2010-2019 (Figure 4). In other words, the stance of monetary policy remains restrictive, despite the 50 bps rate cut on September 18. In our view, the FOMC needs to cut rates further, albeit at a gradual pace, to return the stance of monetary policy to a more neutral setting. While the September jobs report allayed concerns of the jobs market deteriorating in a non-linear way, FOMC members such as Chair Powell and Governor Waller have indicated that the jobs market has become balanced, while San Francisco Fed President Mary Daly, a voter this year, has reiterated she does not want to see it moderate further. If the Committee wants to avoid the labor market cooling beyond the point of comfort, there appears further room to reduce the fed funds rate without rekindling inflation. Although the Committee will receive one more employment report during the blackout period, distortions caused by the impacts of Hurricanes Helene and Milton and a large strike at Boeing lead us to expect the Committee to put much less weight than usual on the report, and focus on the broader trend of the jobs market having cooled substantially over the past year.
Topic for Discussion at the FOMC Meeting: When Should Quantitative Tightening End?
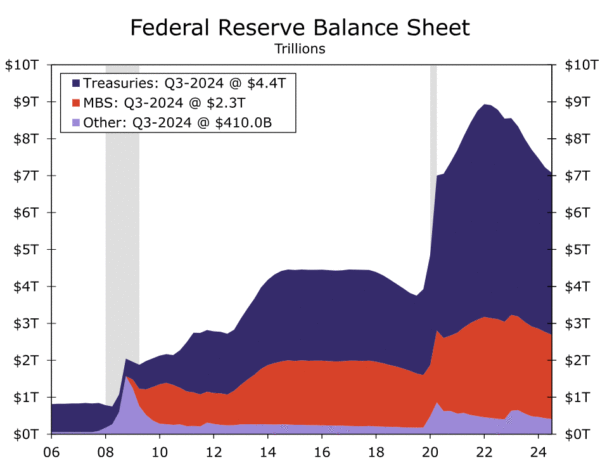
The end-game to quantitative tightening (QT) is a topic that the Committee likely will discuss at the upcoming FOMC meeting. The Federal Reserve has been engaging in QT for more than two years by allowing maturing Treasury securities and mortgage-backed securities (MBS) to roll off its balance sheet up to specified caps each month. The Fed’s balance sheet has contracted from roughly $9 trillion in Q2-2022 to about $7 trillion at present (Figure 5). The central bank’s holdings of Treasury bills, notes and bonds have dropped by $1.4 trillion while its stock of MBS is down by approximately $450 billion. The Federal Reserve undertook quantitative easing (QE) in the aftermath of the financial crisis and again during the pandemic in an effort to ease monetary policy by more than simply cutting the fed funds rate to roughly 0%. QT is the inverse of QE. That is, QT is meant to remove monetary policy accommodation from the financial system.
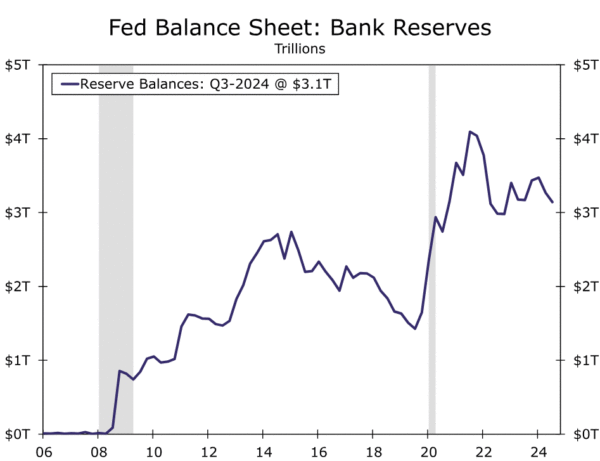
The counterpart to the shrinkage on the asset side of the central bank’s balance sheet is the equivalent reduction in its liabilities. The Fed’s four main liabilities are Federal Reserve notes (i.e., currency in circulation), reverse repo agreements, the U.S. Treasury’s “checking account,” and the reserves that the nation’s commercial banks hold at the central bank. As shown in Figure 6, the reserves of the commercial banking system have fallen by over $1 trillion on balance since late 2021.
Reserves held at the Federal Reserve are an important source of liquidity for the banking system. Maintaining an “ample” amount of reserves is important to the well-functioning of the financial system and critical to ensuring banks have enough ultra-safe, overnight, highly liquid assets to meet their needs. But, at what level should reserves be considered adequately “ample” rather than excessive? The Federal Reserve tracks a wide variety of indicators to assess the degree of scarcity for bank reserves. One key indicator is conditions in the market for Treasury repurchase agreements, also known as the Treasury repo market. Treasury repo transactions form the basis for the secured overnight financing rate (SOFR), a benchmark lending rate in the United States.
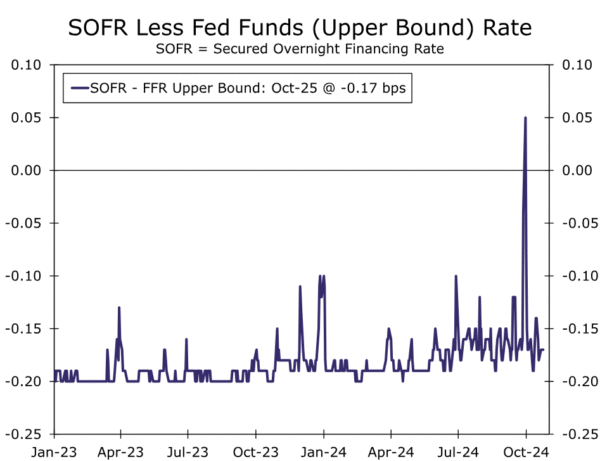
Because SOFR is an overnight financing rate, as the federal funds rate is, it generally fluctuates in the FOMC’s target range for the federal funds rate, which is currently 4.75%-5.00%. Indeed, SOFR generally has traded near the bottom of the fed funds target range in recent years in a sign that reserves have been more than adequate to keep money market rates stable from day-to-day (Figure 7). However, SOFR briefly traded above the top end of the target range at the end of Q3-2024 amid some quarter-end balance sheet pressures on commercial banks. This recent jump in SOFR at quarter-end suggests that bank liquidity is not as ample as it was when the amount of bank reserves at the Fed was higher.
Although SOFR recently traded a bit above the top end of the target range for the fed funds rate, it subsequently has receded back toward the lower end of the target range for the federal funds rate. Furthermore, the quarter-end overshoot was significantly less than in September 2019 when SOFR spiked by 300 bps. As shown in Figure 6, the level of bank reserves is considerably higher today than in September 2019. However, the assets of the commercial banking system are 34% higher today than they were in September 2019. In other words, the banking system needs more reserves today than it did five years ago.
We do not expect the FOMC to announce an end to QT on November 7. We believe that the Committee will maintain the current monthly pace of balance sheet runoff, currently a maximum of $25 billion of Treasury securities and $35 billion of MBS, for a few months longer, probably until sometime in Q1-2025. But the scramble for liquidity in September 2019 led to dislocations in short-term funding markets that Fed officials seem eager to avoid. Therefore, we believe the Committee will have an in-depth discussion at the upcoming policy meeting about the timeline for the cessation of balance sheet runoff. We will learn more about the discussion, should it indeed take place, when the minutes of the November 6-7 FOMC meeting are published on November 26.

