
 on 19 April and 5 August which suggests that the major uptrend phase since its 27 October 2023 swing low remains intact (see Fig 2).)
- Better than expected US non-farm payrolls & unemployment rate for September have revived the soft to non-landing narrative.
- The Citigroup US Economic Surprise Index has improved significantly since August.
- The improvement in US economic growth prospects is likely to benefit the Russell 2000 at least in the medium-term.
Since our last publication, the performance of Russell 2000 was still down by 2.20% as of last Friday, 4 October close but managed to recover from a synchronized risk-off episode that took shape from late July to early August; since its 5 August low, it has rebounded by 11%.
The latest US non-farm payroll print for September has increased significantly from the prior month and surpassed expectations by a wide margin; +254K jobs added versus +140K consensus estimates and above +159K added for August.
In addition, the unemployment rate for September ticked lower to 4.1% from 4.2% in August which thrust the “soft-landing to no-landing” US economic growth narrative back into the limelight.
Last Friday, the Russell 2000 outperformed among the major US stock indices with a daily gain of 1.50% due to its higher sensitivity towards an improvement in economic growth prospects in the US as it comprises small-cap listed companies that derived most of the revenue streams (close to 80% on the aggregate) domestically in the US.
US economic growth prospects have improved
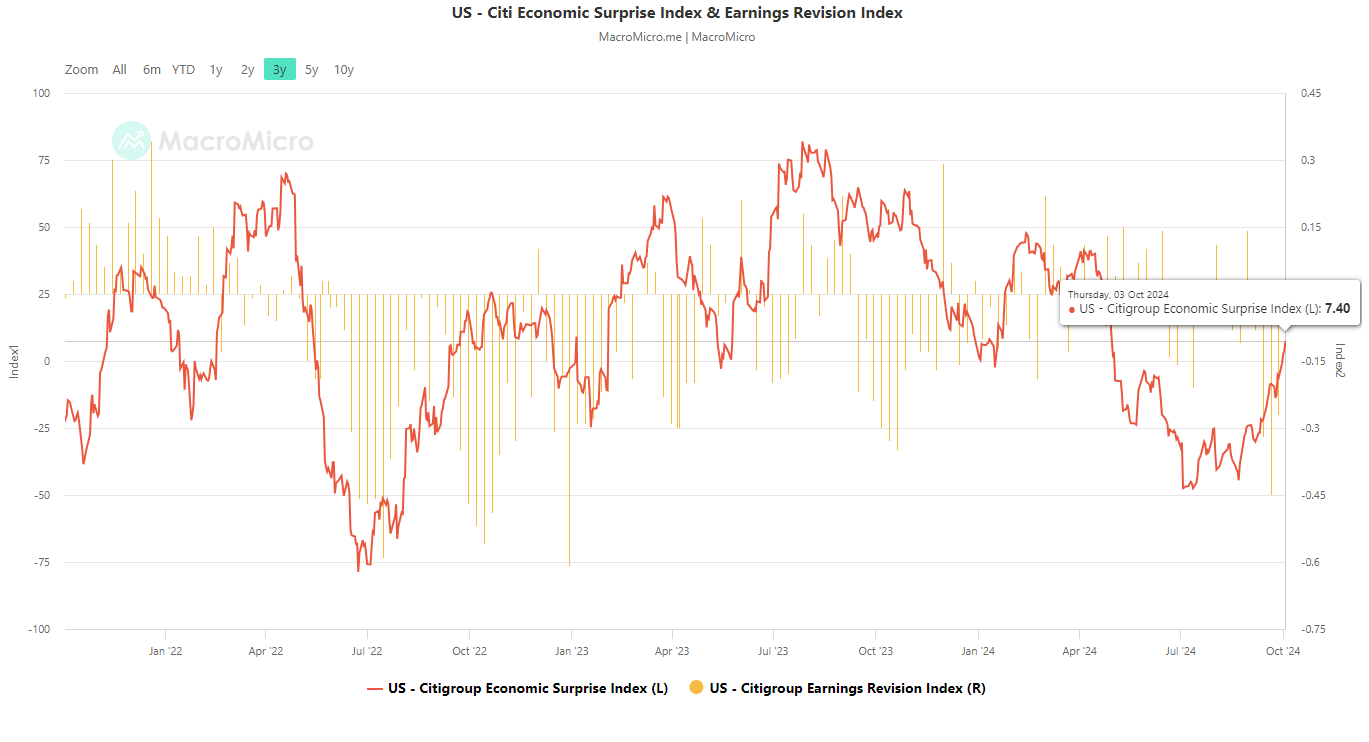
Fig 1: Citigroup US Economic Surprise Index as of 3 Oct 2024 (Source: MacroMicro, click to enlarge chart)
On an accumulated net basis, more key US economic data came in better than expected in the past month where the Citigroup US Economic Surprise Index has improved significantly from a negative print of -44.50 on 22 August to 7.40 as of 3 October; after it hovered below the negative territory since May (see Fig 1).
Hence, the latest positive trend change seen in the Citigroup US Economic Surprise Index is likely to benefit the laggard Russell 2000 as it is still the only major US stock index among the S&P 500, Nasdaq 100, and Dow Jones Industrial Average that has not scaled new fresh all-time high in past three years; it is still 11% below from its current all-time high of 2,458 printed on 8 November 2021 based on last Friday, 4 October closing price.
2,080 key medium-term support to watch on Russell 2000

Fig 2: US Russell 2000 CFD Index major and medium-term trends 7 Oct 2024 (Source: MacroMicro, click to enlarge chart)
In the lens of technical analysis, the two prior corrective decline sequences of 11% and 14% have managed to find support at the 200-day moving average of the US Russell 2000 CFD Index (a proxy of the E-mini Russell 2000 futures) on 19 April and 5 August which suggests that the major uptrend phase since its 27 October 2023 swing low remains intact (see Fig 2).
Secondly, the daily RSI momentum indicator has continued to print a series of “higher lows” since 7 August which suggests that medium-term bullish momentum has resurfaced.
If the 2,080 key medium-term pivotal support holds, the US Russell 2000 CFD Index may resume its impulsive upmove sequence within its major uptrend phase for the next medium-term resistance to come in at 2,350/390.
However, failure to hold at 2,080 with a daily close below it invalidates the bullish tone for a corrective decline to expose the next medium-term support at 1,990, and even the major support of 1,920/1,890 next.