
 has rallied by 6%, surpassing the first 41,440 medium-term resistance mentioned in our report. Also, it printed a fresh all-time closing high of 41,622 on Monday, 16 September before the key US Federal Reserve monetary policy decision outcome due later today.)
- The Dow Jones Industrial (DJIA) has managed to print a fresh all-time high in September while the S&P 500 and Nasdaq 100 have yet to break above their July all-time highs.
- The US Treasury yield curve bull steepener has reinforced a defensive rotation play in the US stock market.
- Watch the key medium-term support of 40,030 on the DJIA.
Since our last publication, the Dow Jones Industrial Average (DJIA) has rallied by 6%, surpassing the first 41,440 medium-term resistance mentioned in our report. Also, it printed a fresh all-time closing high of 41,622 on Monday, 16 September before the key US Federal Reserve monetary policy decision outcome due later today.
The Fed has been widely expected to kickstart its interest rate cut cycle by either 25 basis points (bps) or 50 bps cut on the Fed funds rate, currently at 5.25%-5.00% after it increased the rate to their highest level in nearly two decades and held it constant for 13 months.
50 bps cut is now baked into the interest rates market
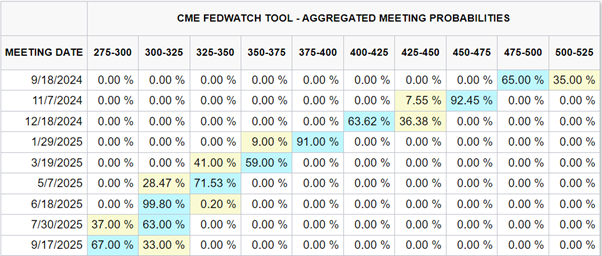
Fig 1: FOMC meetings aggregated probabilities of cuts/hikes as of 18 September 2024 (Source: CME FedWatch tool, click to enlarge chart)
The Fed funds futures market based on data from the CME FedWatch tool has priced in a high odd (65% chance) at this time of the writing that the Fed is likely to enact a jumbo cut of 50 bps today and the expectations of a larger size of cut have increased from a probability of just 14% seen a week ago (see Fig 1).
Overall, the Fed funds futures market is also pricing in a potential 250 bps rate cut in total by the Fed from a year now to bring down the Fed funds rate to 2.75%-3.00% by the 17 September 2025 FOMC meeting from the current rate of 5.25%-5.50%.
Bull steepening US Treasury yield curve reinforces a defensive sector rotation play
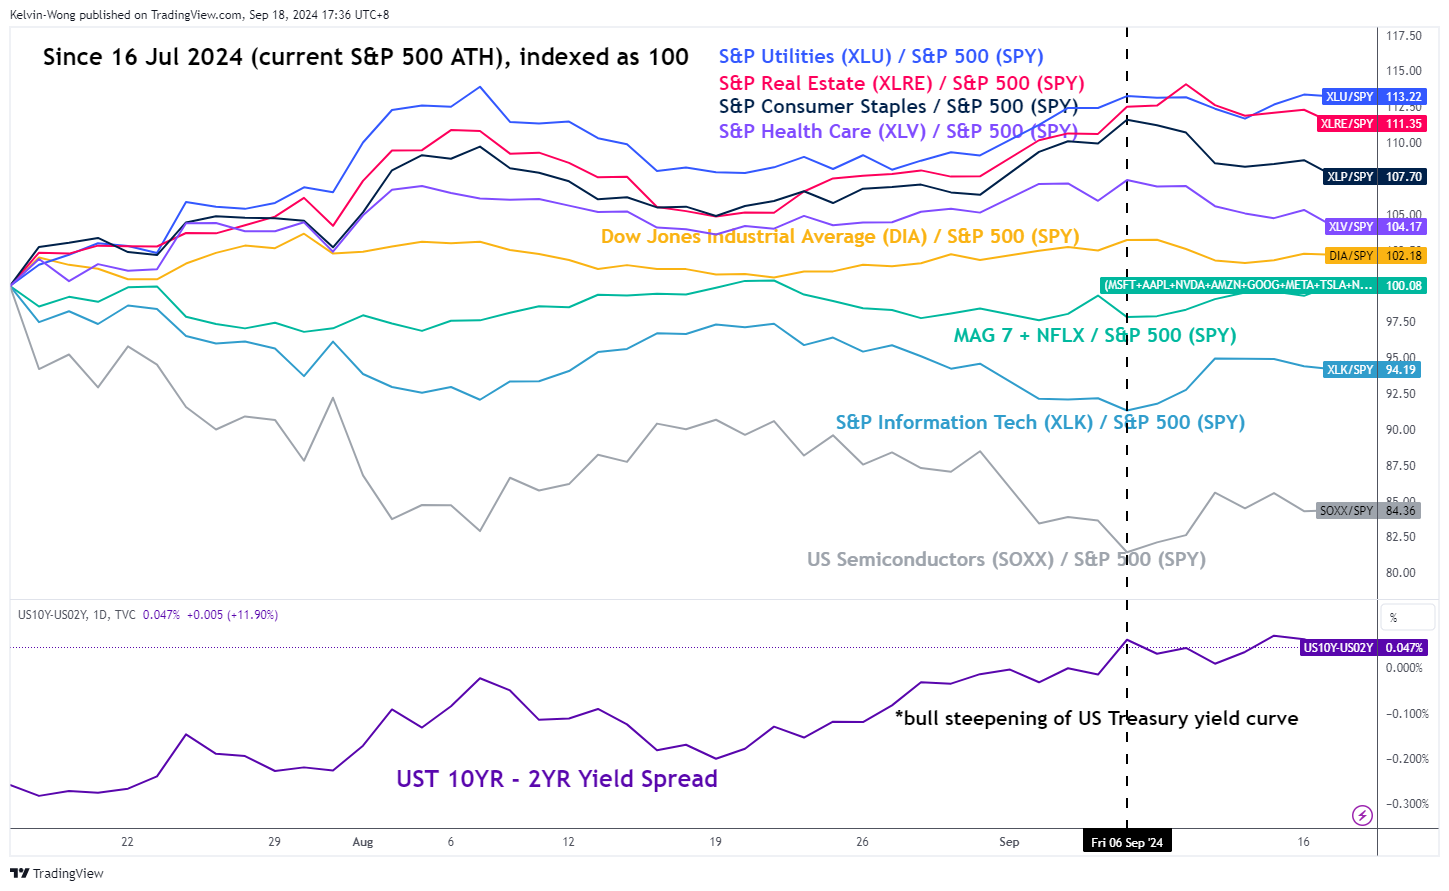
Fig 2: Relative strength of key S&P sectors, Magnificent 7 plus Netflix, US Semiconductors & DJIA against S&P 500 as of 18 Sep 2024 (Source: TradingView, click to enlarge chart)
The expected pace of cuts to bring down the Fed funds rate to 2.75%-3.00% from a year now to just a whisker above the 2.5% median long-run projection pencilled in the previous economic “dot-plot” projections released on the prior June FOMC meeting suggests a recessionary environment in the US.
The US Treasury yield curve (10-year minus 2-year) has un-inverted from more than two years of inversion on 6 September where the 2-year US Treasury yield fell at a faster pace versus the drop of the longer-term10-year Treasury yield.
Concurrently, since the current all-time high of the S&P 500 printed on 16 July 2024, the higher beta Information Technology sector, mega-cap seven cohort plus Netflix, and Semiconductor industry group that were leaders in the past two years of bull run seen in the S&P 500 have now underperformed (see Fig 2).
In contrast, the defensive sectors; Utilities, Real Estate, Consumer Staples, and Health Care have outperformed the S&P 500, together with the Dow Jones Industrial Average which has a lower combined weightage in three of the mega-cap seven stocks (Apple, Amazon, Alphabet, Meta, Microsoft, Nvidia, and Tesla) that represents a significant weightage in the S&P 500, and Nasdaq 100.
The impulsive upmove sequence from the 5 August low remains intact in DJIA
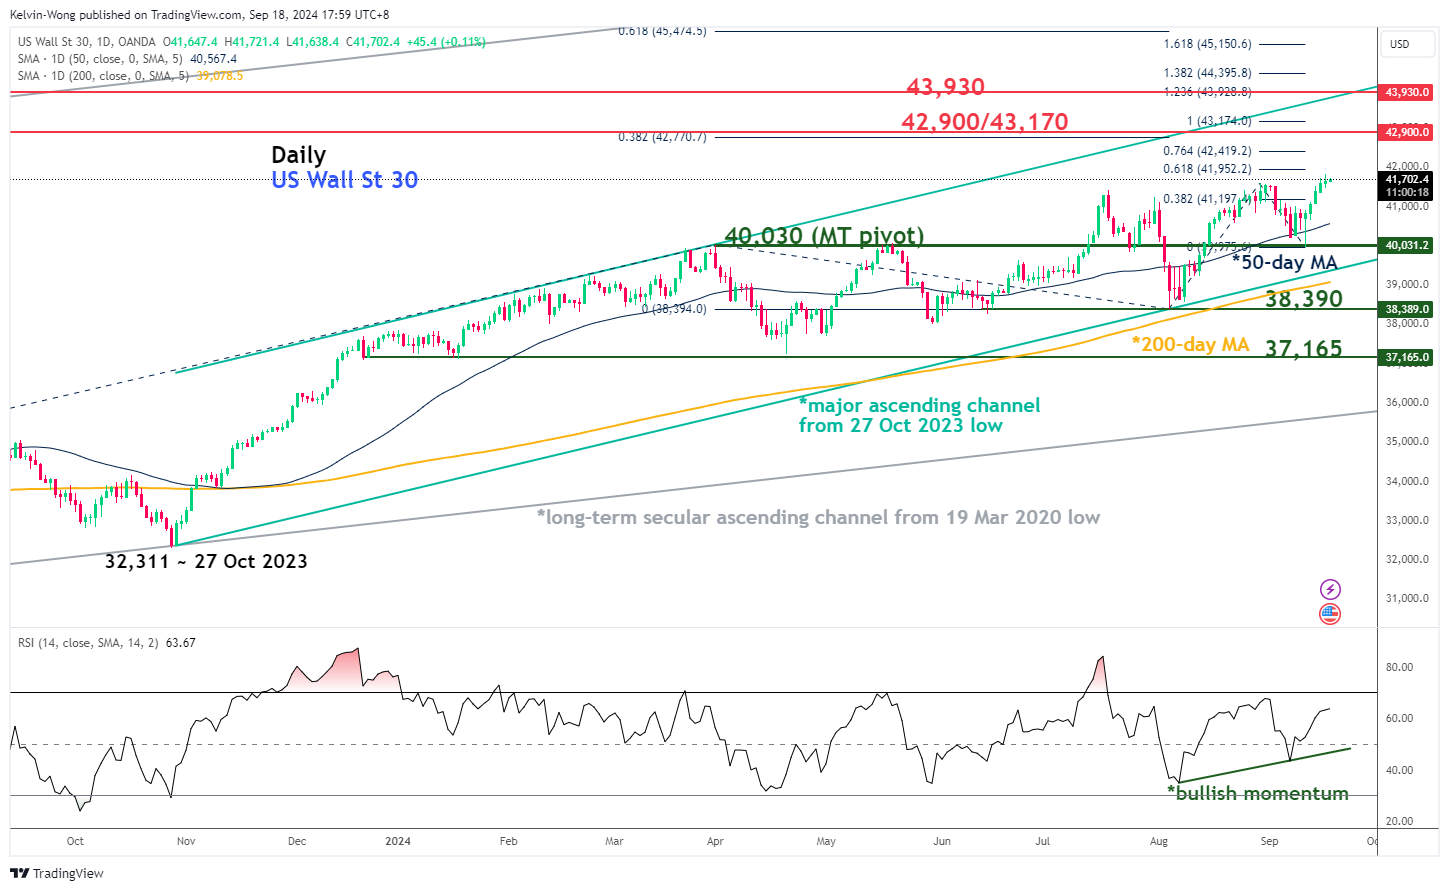
Fig 3: US Wall Street 30 major & medium-term trends as of 18 Sep 2024 (Source: TradingView, click to enlarge chart)
Based on the current price actions of the US Wall Street 30 CFD Index (a proxy of the DJIA futures), the impulsive upmove sequence from the 5 August 2024 low of its major uptrend phase in place since the 27 October 2023 low remains intact.
In addition, the daily RSI momentum indicator has continued to flash out a bullish momentum condition that reinforces the impulsive price action movements.
If the 40,030 key medium-term pivotal support holds, the Index may see the next medium-term resistances coming in at 42,900/43,170 and 43,930 next (also the upper boundary of the major ascending channel from the 27 October 2023 low) (see Fig 3).
On the other hand, a break below 40,030 invalidates the bullish scenario to trigger a potential medium-term corrective decline that may expose the next medium-term supports at 38,390 and 37,165.