
- US PCE data keeps Fed rate cut hopes alive as inflation moves towards 2% target.
- Commodity prices fluctuate on geopolitical fears and OPEC+ production plans.
- US jobs data release is key market-moving event in the week ahead, with potential to impact Fed rate cut decisions.
Week in Review: Rate Cut Hopes Alive Post PCE Data
As the week draws to a close, US PCE data has kept Fed rate cut hopes on track as inflation continues on its way to its 2% target. Consumer spending remains strong and this has kept pricing for a 50 bps cut steady. However with a massive Jobs report next week, we could be having a very different conversation this time next week should the US economy deliver a soft jobs print.
Heading into the Labour day weekend, the rate hike odds for the September 18 meeting has adjusted once more. The theme of the week has seen the probability of a 50 bps cut continue to diminish as robust US data gave market participants something to think about it. As you can see from the CME chart below, the probability of a 50 bps cut declined from 36% to 30% during the course of the week.
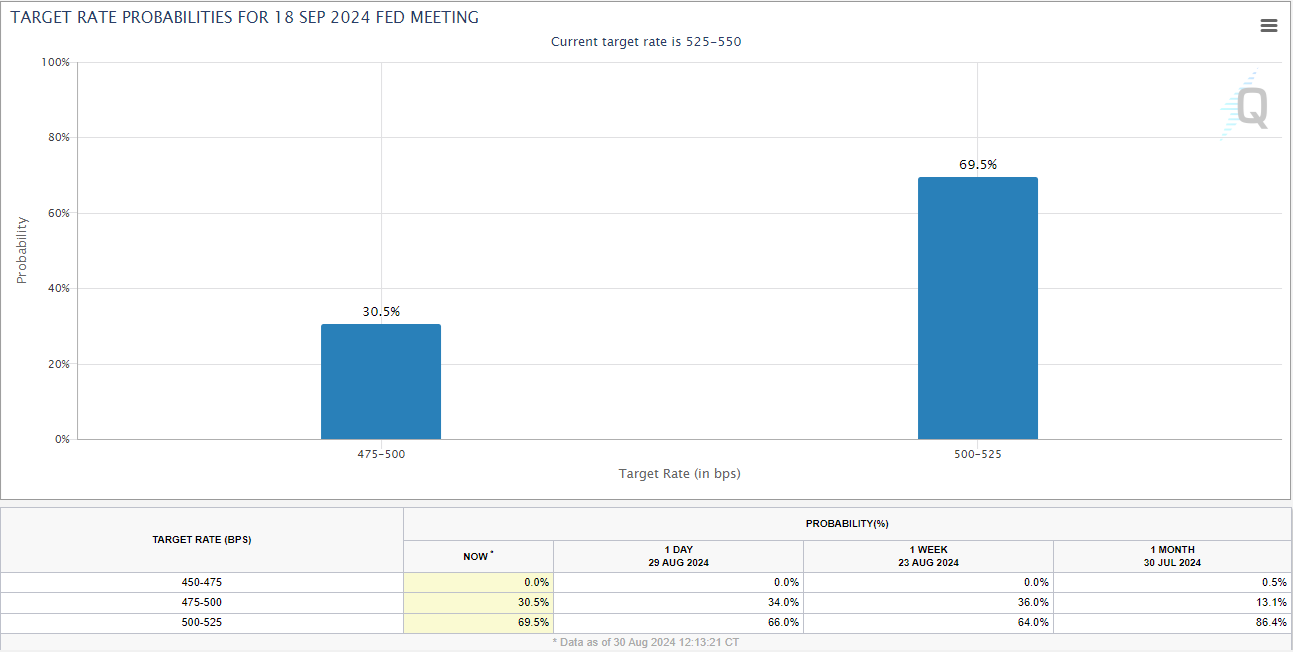
Source: CME FedWatch Tool
The strong GDP and PCE data prints at the back end of the week rescued the US Dollar Index (DXY) which appeared to be on the ropes. The early part of the week saw the greenback lose ground to its G7 counterparts with Cable holding near 30 month highs against the greenback. USD/JPY finally made a break of the 145.00 handle as the greenback recovered some of its early week losses.
Commodity prices went through a rollercoaster week with Brent Crude Oil rising on geopolitical fears and Libyan production going offline. However, news at the back end of the week regarding OPEC + and its proposed output hike saw Oil surrender some early week gains. According to sources, OPEC + are planning to increase output as planned with uncertainty around Libya production and some member states pledging cuts to overcompensate for potential overproduction. This sets up Oil prices for an interesting week.
Gold prices struggled within a tight range for the majority of the week. The $2530 handle in particular has proved a sticking point and a lot of this has to do with how much of the expected rate cuts by the Federal Reserve are already priced in. If we do not see a significant miss next week with the jobs data release this could facilitate a break of the range, if not expect more of the same in the week ahead.
Wall Street indexes are ending August in a completely different light to the start of the month. We all can remember the early August selloff and concern by many market participants, all of which seems to have eased as the summer period draws to a close.
The Nasdaq 100 was trading down 0.03% with the S&P 500 up around 1.5% for the month. Another indication of the change in market sentiment can be seen from the CBOE Volatility Index chart below which shows the change in volatility through the month of August.
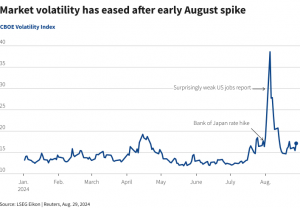
Source: LSEG Workspace
Despite the positive end to the month of August for the S&P 500 I am cautious moving forward. This lies in my views on seasonality and with the US election around the corner the data speaks for itself. During US election years dating back to 1928, the S&P 500 usually experiences a lull and some small losses in September and October ahead of the election before a rally post election and into the Christmas period. Will history repeat itself?
The Week Ahead: US Jobs Data to Rule Out 50 Bps Cut?
The week ahead is actually shaping up to be a massive one for both the US Federal Reserve and Global Central Banks. The debate around rate cuts from the US has shifted toward the size of an initial cut expected on September 18, 2024.
At present the 25 bps cut is winning the race, however a softer jobs report on Friday could throw a spanner in the works. A soft jobs number could weigh on the US Dollar once more and lead to rallies in some risk assets such as US indices. The question that still remains though is how much of the rate cuts have already been priced in?
Let’s break down the key market moving events by region for the week starting Monday September 2.
Asia Pacific Markets
In Asia, the upcoming week is a busy one with a spate of inflation release from the smaller economies. The main areas of interest however will likely be Australian, Chinese and Japanese data.
Following the moderation in Australian inflation this week, GDP data will now be the focus. Unlike many of its counterparts the Reserve Bank of Australia has actually been grappling with concerts around further rate hikes as opposed to rate cuts. Thus a GDP print that shows a cooling economy is sorely needed by the RBA and thus could alleviate concerns of further rate hikes.
China’s official PMI numbers are scheduled for release by the National Bureau of Statistics on Saturday. The August PMI will likely stay mostly steady, dropping just a bit from 49.4 to 49.3. Manufacturing has slowed a little lately because car production has decreased. The Caixin PMI will also be released next Wednesday and should provide further insight into the performance of the Chinese economy and potential demand for raw material in Q4.
Japanese data continues to improve, setting the stage for continued rate hikes by the Bank of Japan (BoJ). The week ahead sees Japan sharing data on capital spending, labor earnings, and household spending, all expected to point to an economic recovery. Capital spending is expected to grow by 10% in the second quarter of 2024, up from 6.8% in the first quarter, thanks to more investments in transport and IT. There is also a strong possibility that labor earnings and household spending will get better in July, with real cash earnings rising for the second month in a row. This should help boost household spending and support the Bank of Japan’s efforts to adjust its policies.
Europe + UK + US
In Europe and the US, it’s another data-heavy week. The US is celebrating Labor day weekend with US markets closed on Monday. This should see a slow start to the week with thin liquidity on Monday..
The Uk will finally get some respite on the data front with the major economic data release coming early in the week. The BRC like-for-like retail sales YoY print will be released on Monday with no other high impact releases scheduled.
The Euro Area as well is expected to enjoy a much quieter week on the data front with composite PMI, PPi and retail sales data the main releases. Following a week in which inflation data put pressure on the Euro as market participants ramped up their rate cut bets it will be interesting to gauge the reaction the data releases.
All eyes are on the US next week as the NFP and jobs report takes center stage. This has become a major release after the largest downward revision in Jobs numbers since the Global Financial Crisis. However, the past week’s GDP and PCE data restored some confidence but the labor data remains the kingmaker ahead of the September 18 Fed meeting.
A softer jobs print on Friday could increase expectation of a 50 bps cut and scupper the DXY’s attempt at a recovery from 13 month-lows.
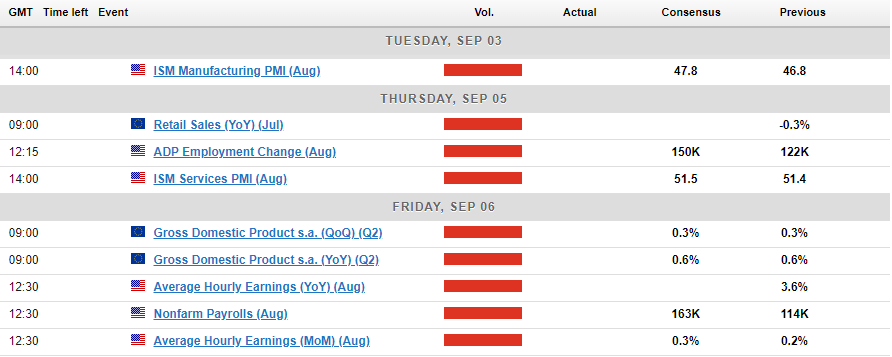
Chart of the Week
This week’s highlighted chart brings us back to the US Dollar Index (DXY) chart which should be no surprise. The importance of the US Dollar and US data in the week ahead makes this a no-brainer, while the technical picture throws up some interesting takeaways as well.
The DXY hit a 13-month low this week, trading at levels last seen in July 2023. The Greenback enjoyed a late week renaissance of sorts, bouncing aggressively out of a key area of support at the 100.50 level and avoiding a retest of the psychological 100.00 handle.
There is a lot of resistance up ahead though and with the US jobs data potentially serving as a catalyst on Friday, Dollar bulls will be hoping the recovery continues in the early part of the week.
The daily chart below does show that we have had a change of structure (from a price action standpoint) from bearish to bullish as Friday’s daily candle is set to close above the swing high at 101.53.
This would mean that the DXY is now on track to either push on or if there is a pullback it will likely be to print a higher low above the 100.50. WIll the NFP data facilitate a break below the 100.50 handle? This is a possibility but it would require a significant downside miss in my opinion for such a move to occur.
Immediate resistance rests at 102.16 and 102.64. Beyond that there is further resistance available 103.00, 103.65 and 104.00 which houses the 200-day MA as well.
US Dollar Index (DXY) Daily Chart – August 30, 2024
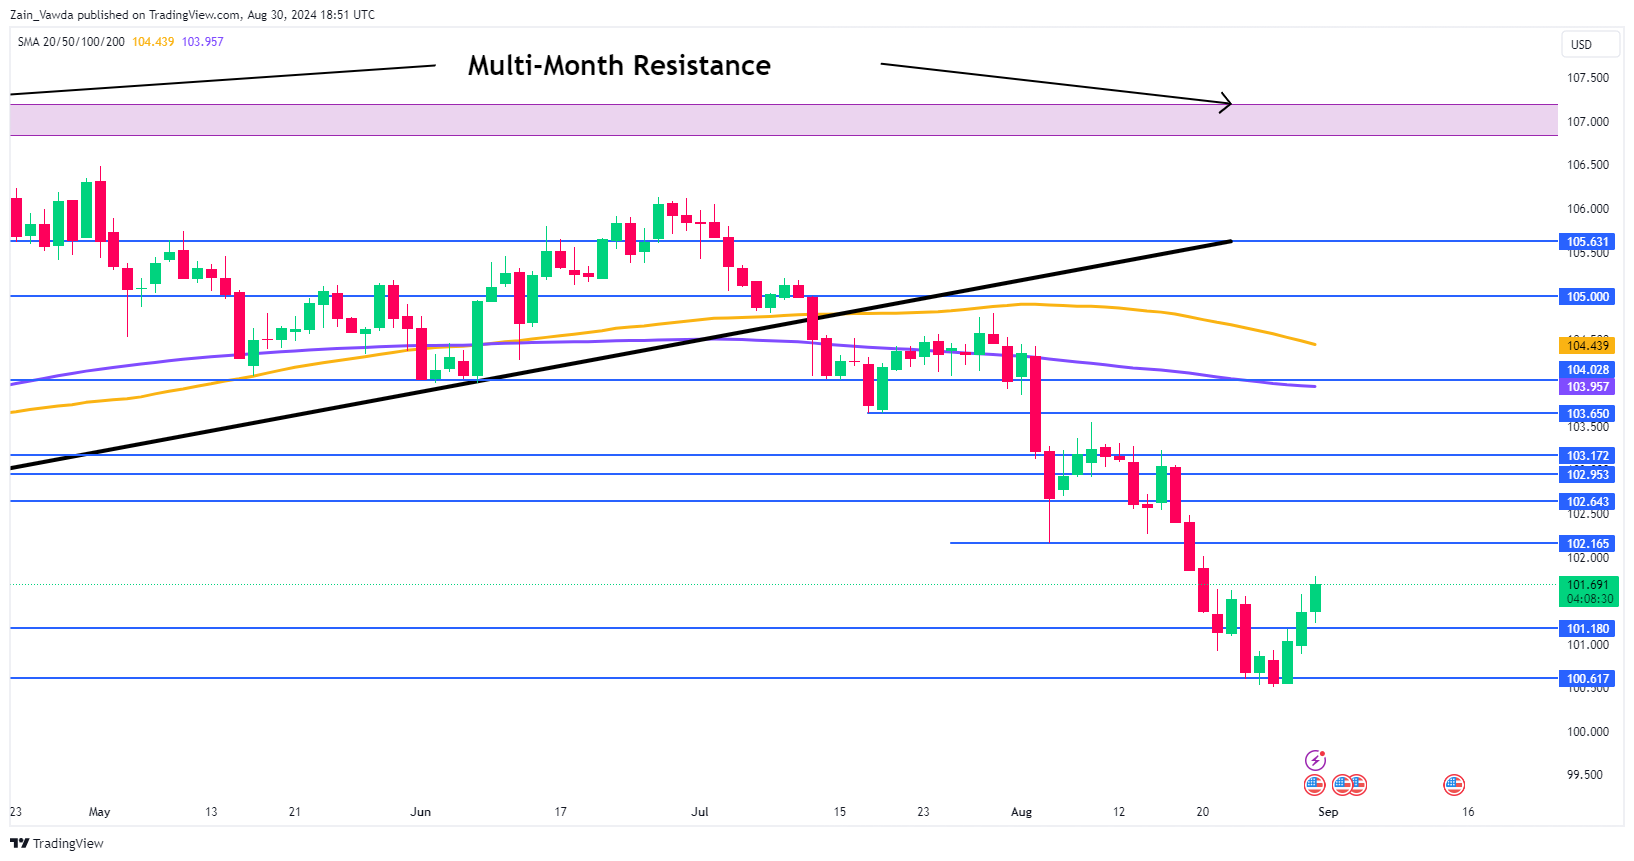
Source:TradingView.Com (click to enlarge)
Key Levels to Consider:
Support:
- 101.50
- 100.50
- 100.00
Resistance:
- 102.16
- 103.00
- 104.00 (200-day MA)