
- Fed Chair Powell’s speech in the Jackson Hole symposium has cemented the expectations of a Fed funds rate cut in the upcoming September FOMC meeting.
- The uncertainty element is the magnitude and the pace of the upcoming Fed funds rate cut cycle.
- Upcoming key US growth data such as ISM manufacturing, and services PMIs (including their sub-components) as well as labour market data will be heavily scrutinized.
- An ideal soft-landing scenario in the US economy coupled with a further bull steepening US Treasury yield curve scenario is likely to spur a potential outperformance of the current laggards; value-oriented stocks, Dow Jones Industrial Average, and Russell 2000.
- A Fed dovish pivot coupled with the US economy that is already in the motion of a recession may be detrimental to the US stock market.
The annual Jackson Hole symposium has been done and dusted. US Federal Reserve Chairman Jerome Powell has given the clearest hint that the Fed may kickstart its interest rate cut cycle at the upcoming 18th September FOMC meeting after holding the Fed funds rate at a two-decade high of 5.25%-5.50%.
He stated, “The time has come for policy to adjust. The direction of travel is clear, and the timing and pace of rate cuts will depend on incoming data, the evolving outlook, and the balance of risks”.
Fed funds interest rate futures market according to calculations compiled by the CME FedWatch tool has already priced in such a dovish stance as a high probability of 63% of a 25 basis point (bps) cut on the Fed funds interest rate has been assigned to the September FOMC meeting followed by a 50 bps cut (77% chance) on 7 November FOMC and another 25 bps (77% chance) on 18 December FOMC; overall a possible 100 bps cut in the Fed funds rate before 2024 ends at this time of the writing.
Right now, market participants are likely to focus on the state of the US economy in line with the Fed’s interest rate cut cycle on whether the Fed is late in the game of enacting its interest rate cuts and the potential impact on risk assets such as equities and broad-based benchmark stock indices.
Bad economic data is now considered as bad “news”
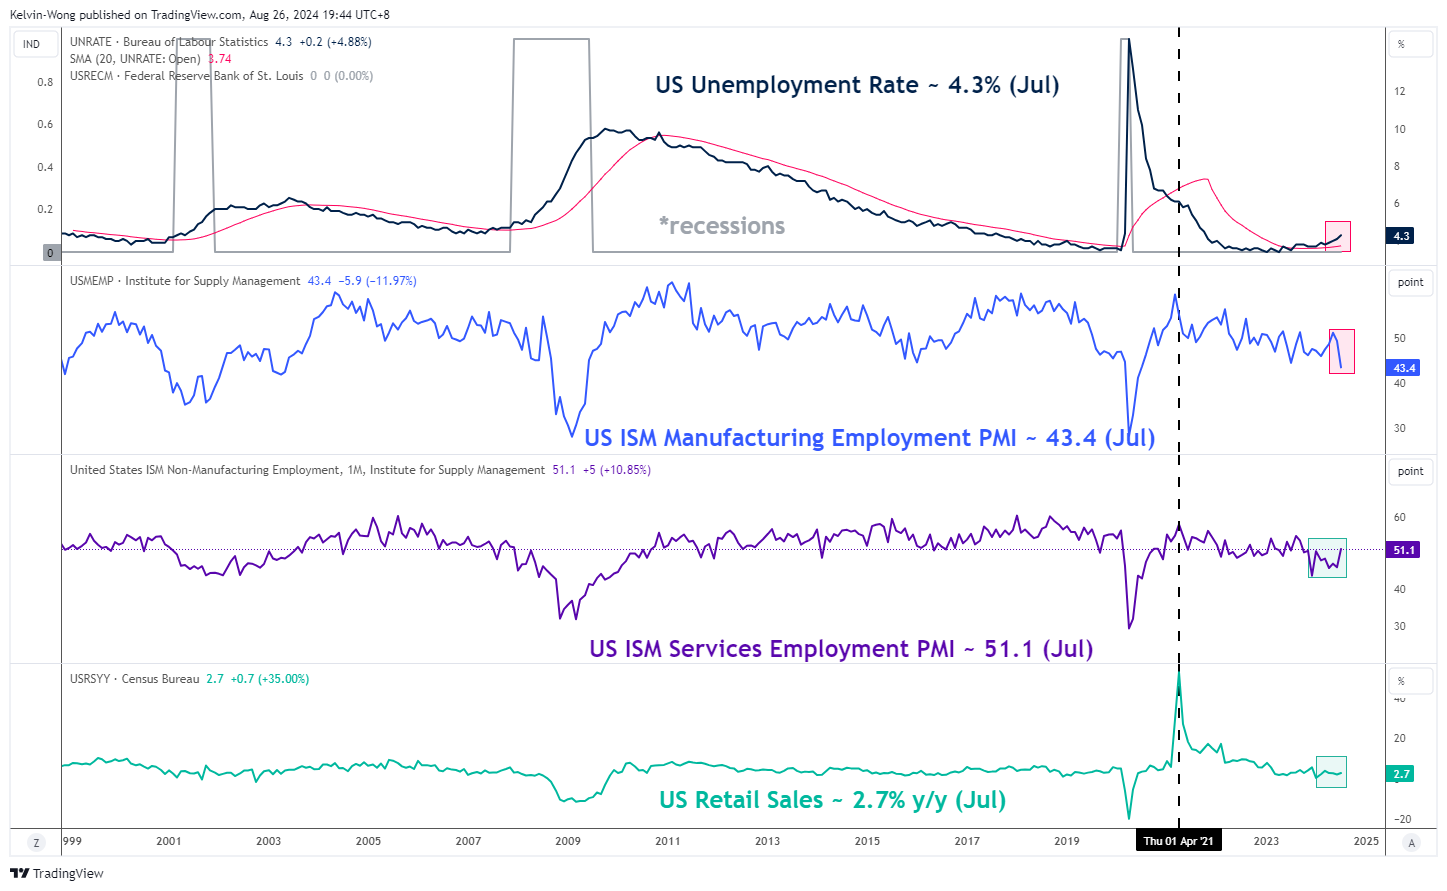
Fig 1: US Unemployment Rate, ISM Manufacturing/Services Employment PMI & Retail Sales trends (Source: Trading View, click to enlarge chart)
Fed Chair Powell has reiterated in his speech during last Friday’s Jackson Hole symposium that the upside risks to inflation have diminished but the downside risks to employment have increased.
Hence, any leading economic data and labour market conditions such as ISM services, manufacturing PMIs, its employment sub-components, non-farm payrolls, unemployment rate, and retail sales that indicate a deterioration in growth and employment may trigger another similar risk-off episode that took place recently in late July to early August that saw synchronized losses in the global stock indices (see Fig 1).
If such a scenario occurs, the Fed may be forced to embark on larger interest rate cuts to negate the adverse effects of a recession that is already in motion which in turn creates a potential cascading negative feedback loop into the major US stock indices such as the S&P 500 and Nasdaq 100.
A dovish Fed pivot may not be good for risk assets
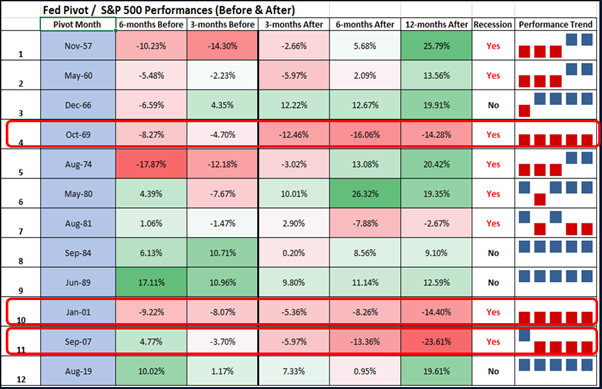
Fig 2: Impact of Fed dovish pivots on past performances of S&P 500 during recessions (Source: Trading View, click to enlarge chart)
In addition, based on data since 1957, when the Fed pivoted to kickstart an interest rate cut cycle when the US economy was already in recession, the three-month, six-month, and twelve-month returns of the S&P 500 after the implementation of respective first-interest rate cut was detrimental on the average.
The S&P 500 fared the worst during the Fed pivots of October 1969, January 2001 and September 2007 (see Fig 2).
A soft land scenario in the US may benefit the laggards
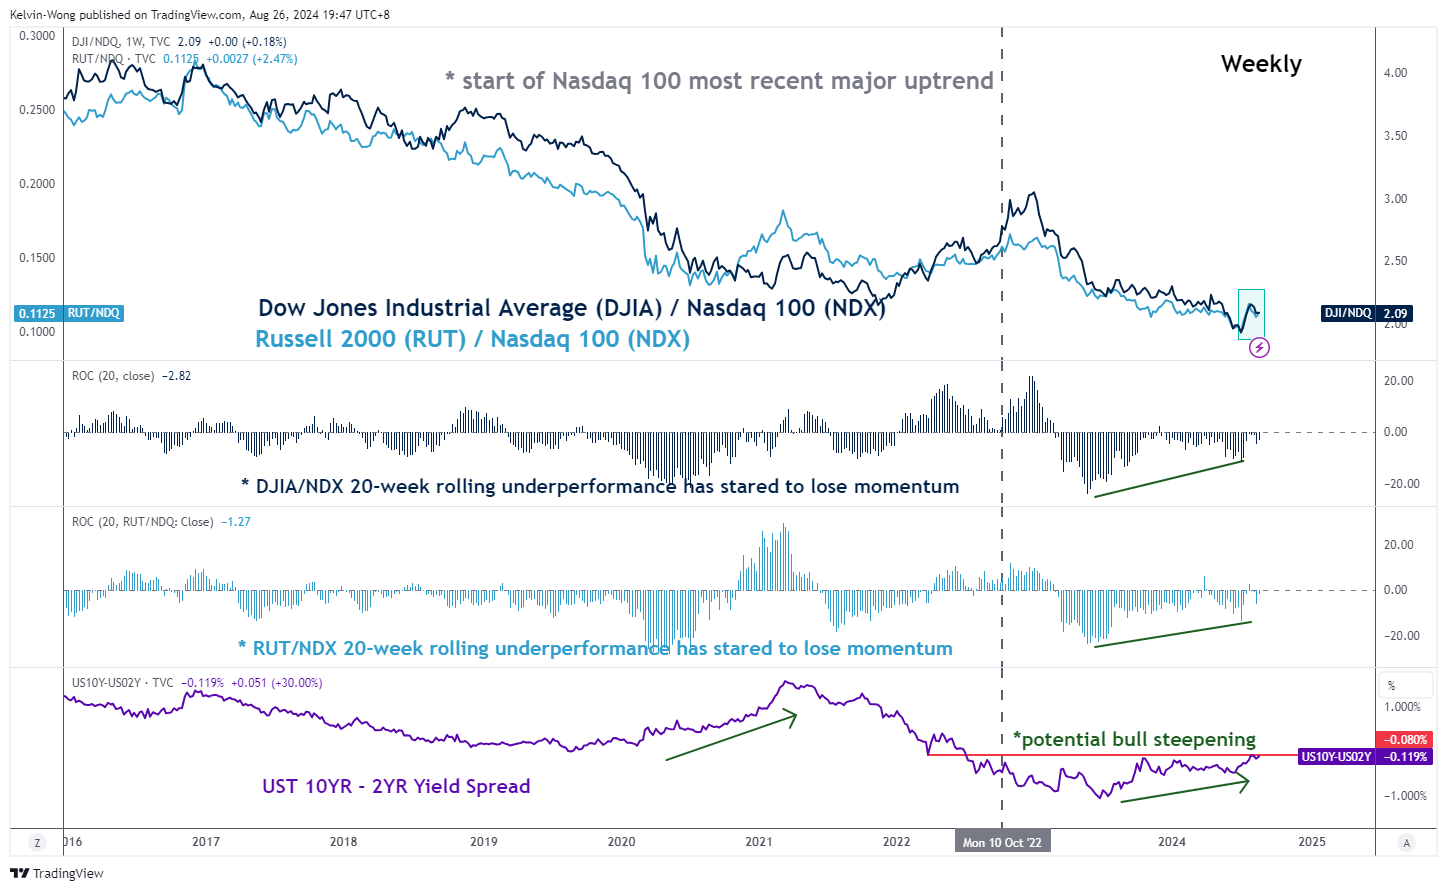
Fig 3: US Treasury yield curve & DJIA, Russell 2000 relative performances over Nasdaq 100 trends as of 23 Aug 2024 (Source: Trading View, click to enlarge chart)
The current state of affairs in the global markets is playing out a potential bull steepening of the US Treasury yield curve, taking into account the difference between the 10-year and 2-year US Treasury yields.
The 2-year US Treasury yield which is more sensitive to the Fed’s monetary policy stance has been falling at a faster pace than the 10-year US Treasury yield (a proxy of US economic growth conditions). Last week, the 2-year has declined by 13 bps versus a loss of 8 bps seen in the 10-year.
Even on a month-to-date performance as of 26 August, the 2-year Treasury yield has declined at a higher magnitude over the 10-year (-35 bps versus -22 bps).
A further potential bull steepening the US Treasury yield curve indicates the pricing of a soft-landing scenario (provided no adverse surprise shock from deterioration in growth and labour market data) in the US economy while the Fed neutralizes its prior hawkish monetary policy which in turn may benefit the laggards such value-oriented US equities, the Dow Jones Industrial Average and Russell 2000 (see Fig 3).
The potential outperformance of these laggards over the current heavily concentrated mega-cap technology stocks and Nasdaq 100 which has outperformed the broad market since March 2020 indicates a healthy rotation that may extend the ongoing 15-year long-term secular bullish trend of the US stock market in place since March 2009.