U.S. Review
All Quiet on the Domestic Front
- This week’s economic release calendar was barren compared to last week’s jam-packed schedule. However, what data were released largely confirmed the trends of strong labor market demand, elevated small business confidence behind regulation rollbacks, and credit growth continuing its steady growth as spending builds momentum.
- The job openings rate remained at its all-time high and the Wells Fargo/Gallup Small Business Survey showed high levels of confidence. However, reported difficulty in finding quality labor is consistent with other indicators of a tight labor market.
All Quiet on the Domestic Front
In a light week for economic indicators, the few readings we received pointed to a continuation of solid job growth, sky high small business confidence and steady consumer credit growth as spending remains elevated.
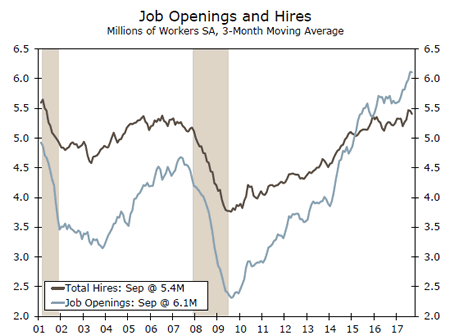
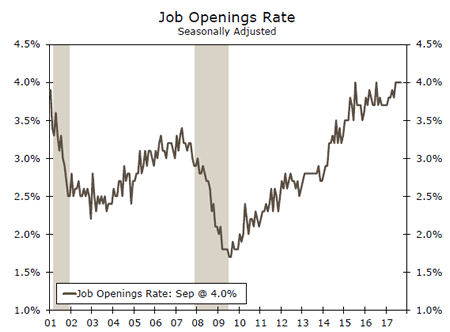
On Tuesday, the JOLTS survey was released and indicated that demand for workers continues exhibiting strength. This is not necessarily a surprising story, given that we are in the midst of the tightest labor market, at just 4.1 percent unemployment, since December 2000. The job openings rate, which is the percentage of openings compared to the total level of employment including open roles, stayed flat on the month at a record high of 4.0 percent (top chart). This speaks not only to the high level of labor demand, but also to the elevated level of total employment, and indicates that the labor market remains on firm ground with room to run. The quit rate rose to 2.2 percent, but has fluctuated around the same level for essentially all of 2017. This could be at least partially driven by an aging workforce as Baby Boomers enter the late stages of their careers, and job changes become less frequent as employees age. An increase in job switches by choice would be an encouraging sign, as it should coax wage growth higher.
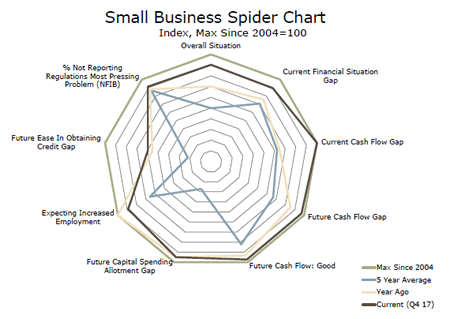
The Wells Fargo/Gallup Small Business Index fell 3 points to 103 in Q4, good for the second, only to Q3, strongest reading in the current expansion. Strong small business confidence has been primarily boosted by strong consumer spending driving sales higher, and rollbacks of business regulations under the Trump administration. However, confidence has not been limited to these two areas, as gains have been broadly based. The spider chart (middle) we have developed tracks metrics of small business we believe correspond most closely with capital spending by small businesses. The chart shows nearly all metrics improving from a year ago, and many approaching all-time highs. The encouraging confidence measures among small businesses could indicate an improvement in business fixed investment that would help improve headline GDP growth. The primary issue plaguing small businesses surrounds the availability of quality labor, with 16 percent of owners reporting this as their top concern. Compounding this problem is the high percentage of small business owners planning to increase jobs at their company within the next 12 months at 32 percent, the second-highest reading in the history of the survey. This reinforces September’s JOLTS story of high labor demand and the optimism of small business expansion.
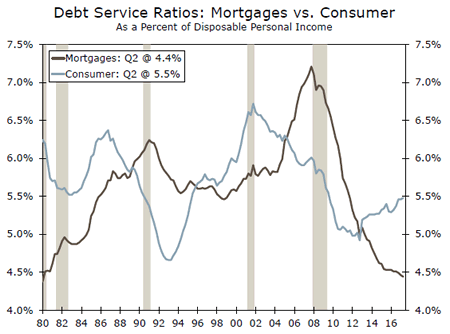
Consumer credit grew $20.8 billion in September, beating market expectations and showing the strongest gain since November 2016. The growth was bolstered by revolving and nonrevolving credit and is up 6.6 percent over the year. This supports continued increases in personal consumption, despite lagging income growth. At first glance, credit growth-absent-significant income gains could be construed as a possible snag. However, the debt service ratio, which is essentially a consumer’s cost of capital, sits at 5.5 percent of disposable income, well below alltime highs and levels seen in recession.
U.S. Outlook
CPI • Wednesday
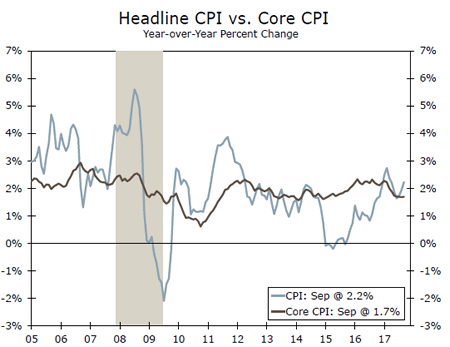
Higher gas prices pushed the CPI up 0.5 percent in September, as was widely expected. The combination of refinery outages caused by Hurricane Harvey and Florida’s mass evacuation from Hurricane Irma caused a 13.1 percent spike in gasoline prices, which accounted for about three-quarters of the CPI increase in September. Inflation looked pretty anemic outside of the hurricane effects, however.
Excluding food and energy, the trend in the core CPI remained weak. Core CPI rose 1.7 percent over the year, remaining short of the FOMC’s 2 percent target. September’s inflation readings counted another month without the long-awaited pickup in inflation that should be in the offing given other fundamentals in the economy. It is still widely expected that the Fed will go ahead with increasing the fed funds rate in December, however.
Previous: 0.5% Wells Fargo: 0.1% Consensus: 0.1% (Month-over-Month)
Retail Sales • Wednesday
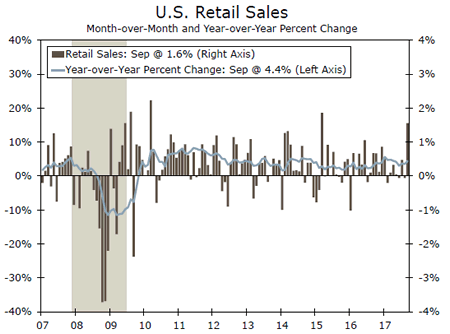
Harvey and Irma provided a huge boost to retail sales to round out the third quarter. Sales rose 1.6 percent on the month, and even excluding auto sales, were up 1.0 percent. Control group sales, which go into the GDP calculation for personal consumption, rose 0.4 percent, which was a strong rebound after a flat reading in August.
Strong sales in July and September boosted GDP in Q3 significantly as personal consumption added 1.6 percentage points to growth. Hurricanes were not the only reason sales were up so strongly in Q3, but surveys of consumer sentiment have shown an upbeat U.S. consumer encouraged mostly by the strong labor market and income growth prospects. The continued run in the stock market is also supporting optimism. For this reason, we continue to expect the consumer will be a major driver of economic activity in Q4 and into next year.
Previous: 1.6% Wells Fargo: 0.1% Consensus: 0.0% (Month-over-Month)
Housing Starts • Friday
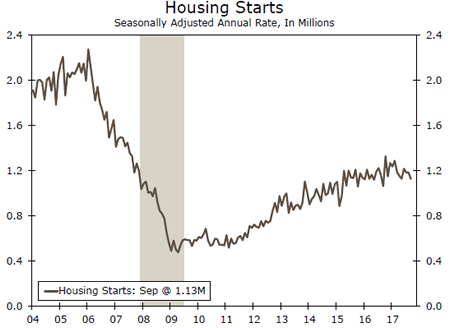
Housing starts declined more than expected in September, to a 1.127 million-unit pace as hurricanes paused building activity in the South. August starts were revised slightly higher though. Permits were also running well ahead of starts in September, which sets the stage for a rebound in coming months.
Repairs of damaged homes do not count as housing starts, although they may affect activity over the next few months by worsening construction labor shortages or driving up building costs, or by causing delays for new projects. We expect more volatility in the fourth quarter.
Residential investment in the GDP calculations declined 6 percent in Q3, and we expect another small decline in Q4 before a rebound in the first half of 2018. The NOAA also predicts another warmerthan- usual winter, which may exacerbate volatility into next spring.
Previous: 1.127M Wells Fargo: 1.167M Consensus: 1.193M
Global Review
The Reserve Bank of Australia’s Dilemma
- Even as many other central banks are at various points along the path to normalization, the Reserve Bank of Australia has kept its cash rate at an all-time low since August 2016.
- In this week’s Global Review, we discuss the vexing situation for policymakers in Australia, which boils down to this: Low rates have been a factor in driving consumer debt to worryingly high levels. But amid tepid consumer spending and soft inflation, the economy could benefit from even lower rates. However, that remedy could make the consumer spending problem even worse in the long run.
The Reserve Bank of Australia’s Dilemma
An evolving theme in global financial markets in the second half of 2017 is that many of the world’s central banks are in various stages of removing ultra-accommodative monetary policies. In separate reports over the past week we discuss the varying prospects at the European Central Bank, the Bank of England and the Bank of Korea—all these reports are available on our website.
There are a few holdouts. At its meeting at the end of October, policymakers at the Bank of Japan made it clear that they have no intention to dial back the comprehensive set of accommodative monetary policy measures in place in Japan. Another central bank that is bucking the trend is the Reserve Bank of Australia (RBA).
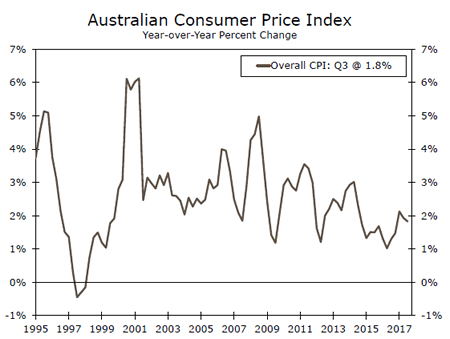
At its meeting in Sydney earlier this week, the RBA held its cash rate unchanged at 1.50 percent where it has been since August 2016. It was no secret that policymakers would stand pat. Every one of the 27 economists surveyed by Bloomberg correctly anticipated that the RBA would remain on hold. The accompanying statement said that "inflation was likely to remain low for some time," suggesting that the RBA will remain on hold.
With the unique distinction of having avoided a recession during the global slowdown in 2009, the rate environment in Australia has been higher than other parts of the developed world for some time. That is likely to change. If the Federal Reserve raises rates at its December meeting, as we expect it will, the fed funds rate will be the same as the RBA’s cash rate for first time since 2001.
We wrote in April that the RBA was in a Catch-22, because after cutting rates to stimulate growth, households had taken on too much debt as low interest rates helped fuel a sharp rise in house prices which could hold back consumption. The trouble is that additional rate cuts risks even more piling-on of debt.
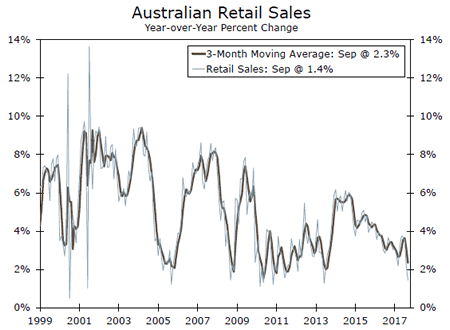
In the latest manifestation of this dilemma, RBA Governor Philip Lowe said this week that a "continuing source of uncertainty is the outlook for household consumption." This was evident in the September retail sales figure released last week, which showed no change. This followed a 0.6 percent monthly decline in the prior month which had most analysts looking for a bounce.
Our currency strategists think the negative influences of monetary policy dynamics on the Aussie dollar will be outweighed by the positive influences from the strengthening in commodity prices and, on that basis, they anticipate a modestly stronger Australian dollar over time. This makes the vexing challenges for the RBA even harder, as any foreign exchange pass-through effect would put downward pressure on already-low inflation.
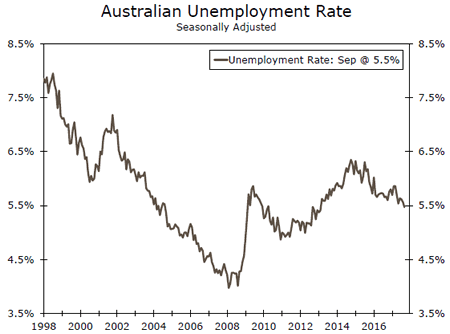
The upside for Australia is that the labor market is firming and the unemployment rate has been trending lower over the past year, although that has not yet translated into significant wage gains. A firming in global growth may also translate into stronger exports for the resource-rich Australian economy.
Stuck between needing to stimulate the economy through lower rates yet not wanting to drive household debt even higher, we expect the RBA to remain on hold well into 2018.
Global Outlook
China Industrial Production • Monday
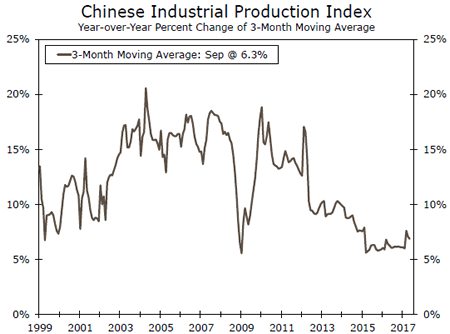
Markets will be watching news coming from China early in the week as the country is slated to release the industrial production index for October on Monday. The year-over-year growth rate started to trend downward in July but reversed its course in September of this year, increasing from 6.0 percent in August to 6.6 percent in September. An improvement from September’s reading would probably be greeted favorably as market analysts are expecting industrial production growth to slow down a bit on a year-over-year basis, to 6.2 percent.
On the same day the country is also releasing the retail sales data. Retail sales rose 10.3 percent in September and markets are expecting sales growth to be up a bit, to 10.4 percent. Retail sales have been growing at a 10 to 11 percent rate, year over year, for the past several years, and thus, we do not expect any departure from these rates.
Previous: 6.6% Consensus: 6.2% (Year-over-Year)
Japan Q3 GDP • Tuesday
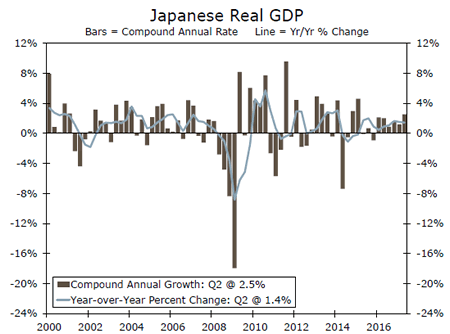
The Japanese economy surprised markets in Q2 with a relatively strong performance, growing 0.6 percent, not annualized and by 2.5 percent annualized. This was the strongest performance by the Japanese economy since the first quarter of 2015, when it grew at an annualized rate of 4.6 percent.
Today, markets are expecting the economy to have slowed down a bit during Q3, with a market consensus estimate of 1.5 percent annualized. Our forecast is for a 1.6 percent annualized rate for the quarter, as we expect some payback from the strong performance of Q2.
Of course, any improvement in Q3 from the rate we saw in Q2 will greatly help the global economic cause for a continuous improvement in economic conditions. However, we will not hold our breath for it.
Previous: 2.5% Wells Fargo: 1.6% Consensus: 1.5% (Quarter-over-Quarter, Annualized)
Eurozone Industrial Production • Tuesday
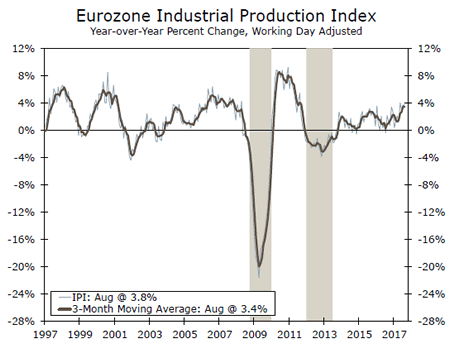
There are several data points coming out next week from the Eurozone. One of these data points is industrial production for September. The industrial sector was relatively strong in August, increasing 1.4 percent on a seasonally adjusted basis. This impressive result was reflected in the flash GDP release for Q3 which was stronger than the consensus was expecting. Preliminary results for GDP will also be released on Tuesday and will probably reaffirm the relatively strong performance of the flash release.
On the same day, the region will also release the result for the ZEW expectations survey for November. The survey declined in October, to 26.7 compared to 31.7 in September. Furthermore, the index weakened a bit in the third quarter compared to the second quarter and started on a weak note in Q4. Thus, an improvement in expectations in November could be a positive sign for the rest of the year.
Previous: 1.4% Consensus: -0.6% (Month-over-Month)
Point of View
Interest Rate Watch
Flatter Yield Curve Raises Eyebrows
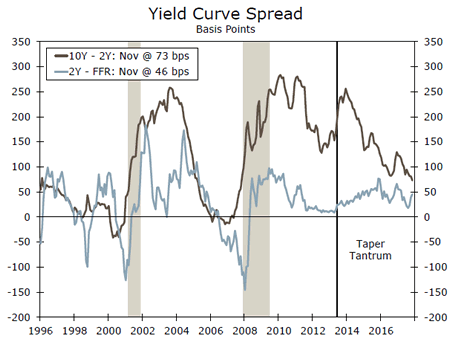
New cycle lows in the 2s/10s spread brought the flattening in the yield curve back into focus this week. The difference between the yields on 10-year and 2-year Treasuries fell to 69 bps earlier this week, which is 16 bps narrower than a month ago and the lowest level since 2007 (top chart).
While the yield curve remains far from inverted, the decline in the 2s/10s spread back to 2007 levels, as well as flattening in other parts of the yield curve, has raised concerns about the outlook for growth. Our probit model of the chance of a recession in the next months using the yield spread between 10-year Treasuries and 3-month T-bills is below 10 percent.
Further Flattening Ahead
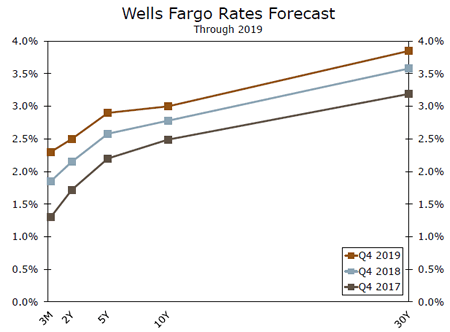
Our forecast for the U.S. economy does not call for a recession over the next two years, but we do expect the yield curve to flatten further (middle chart).
The FOMC is widely expected to hike rates again in December, with the current market probability above 90 percent. There is less of a consensus for 2018, with the median estimate from the FOMC projecting three hikes next year and markets currently penciling in only one hike. We take a middle view and anticipate two rate increases next year, but the bottom line is that short-term rates will likely move higher next year.
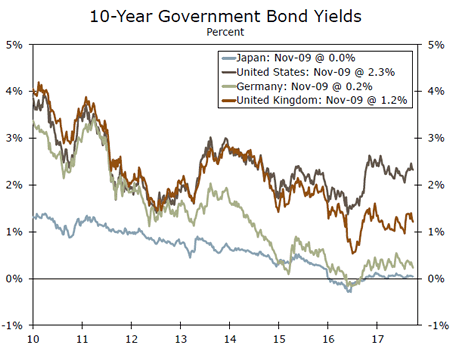
Longer-term rates should also rise as U.S. growth strengthens, but we expect to see further curve flattening. The slow pace of Fed tightening from what are already low levels of rates may continue to push some investors to extend duration. At the same time, low interest rates around the world continue to make U.S. Treasuries look relatively attractive (bottom chart). Foreign net purchases of long-term Treasuries have on average been positive this year. A third factor limiting the rise in longer-term Treasury rates is the persistence of low inflation, leading investors to demand lower inflation compensation.
While the yield curve is expected to flatten further on trend in the coming months, a significantly wide federal deficit and/or pickup in inflation could upset the pace and degree of flattening.
Credit Market Insights
Mixed Credit Standards in Q3
The Federal Reserve’s October 2017 Senior Loan Officer Opinion Survey (SLOOS) portrayed varied lending practices among households and businesses.
Banks reported relaxing lending standards on business commercial and industrial (C&I) loans for the third consecutive quarter, as demand continued to weaken. Increased strength in business investment suggests firms turned to other sources of funding to fuel capital spending. The loosening in lending standards, coupled with the positive outlook for business investment, should drive C&I loan demand higher in the future.
The loosening of lending standards for residential mortgages, yet a tightening of credit card and auto loan standards were reported, while demand remained basically unchanged. Mortgage demand remains weak, as softness persists in existing home sales. As individuals act on the damage of recent hurricanes, demand rose for auto loans.
Banks attribute credit tightening to uncertainties surrounding the economic outlook, possible portfolio deterioration and reduced risk tolerances. But, increases in demand growth can be expected, as a rise in consumer confidence is matched with weakened funding abilities. Such explanations, in line with surges in confidence figures, along with modest wage growth, is driving consumers to run down savings rates or increase borrowing to sustain levels of consumption.
Topic of the Week
Will Trade Deals Close the Trade Deficit?
President Trump is presently in the midst of a 13-day trip to Asia during which he will visit Japan, South Korea, China, Vietnam and the Philippines (hereafter "Asia-5"). One of the expressed purposes of the trip is to discuss U.S. trade relations with these important trading partners, and the president has already closed some deals that will be welcomed by the affected American businesses. The administration is also hoping that the deals will help close the gaping U.S. trade deficit.
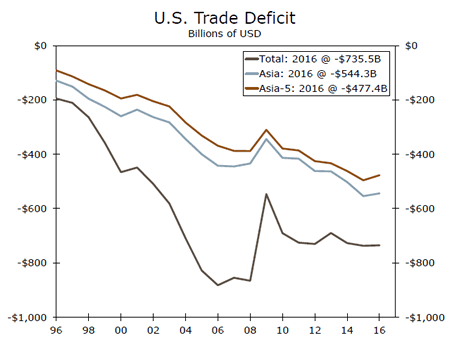
As shown in the top chart, the value of American imports of goods exceeded the value U.S. goods exports by $735 billion in 2016 (i.e., the United States incurred a $735 billion trade deficit last year). More than half of this trade deficit was accounted for by the Asia-5 countries. So anything that can be done to encourage more American exports to these countries will lead to a narrower trade deficit, correct?
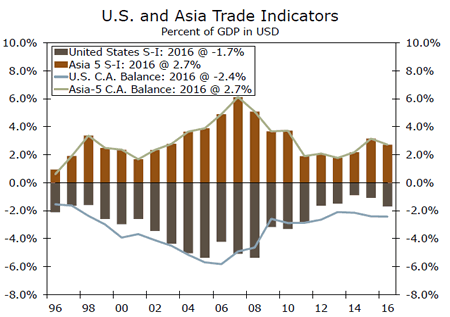
Not so fast. Macroeconomic theory shows that a country’s current account balance is identically equivalent to its savings-investment imbalance. As shown in the bottom chart, the U.S. current account deficit widened during the past decade as the country’s rate of investment increasingly outstripped its savings rate. The current account deficit has narrowed in recent years as the savings imbalance has become less extreme. That said, the national savings rate in the United States continues to fall short of the national investment rate. In short, the United States incurs a current account deficit because it does not save "enough." The Asia-5 incurs an aggregate current account surplus because it saves "too much" in aggregate.
Trade deals do little to change a country’s savings and investment rates. Unless the underlying savingsinvestment imbalance is corrected, a country will continue to incur a current account imbalance. Until the American household, business or public sectors begin to save more and/or investment weakens, the United States will continue to incur current account deficits.
