
Summary
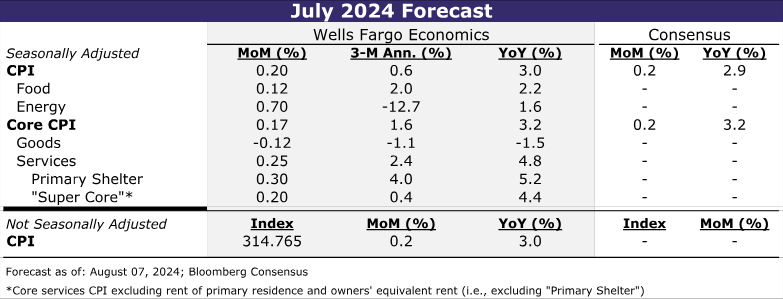
The July CPI report is likely to further the case that inflation is quieting down even if it has not yet returned all the way back to the Fed’s target. We look for headline CPI to have advanced 0.2% in July, which would keep the year-over-year rate steady at more than a three-year low of 3.0%. The core CPI also looks set to advance 0.2% in July amid a rebound in some of the more volatile “super core” components. However, we expect the step-down in shelter inflation from the first five months of the year to be sustained and for prices among core goods to continue to decline outright. If realized, the 12-month change in the core CPI would fall to a fresh cycle low of 3.2%.
Looking beyond July, we expect inflation to continue to subside. Labor costs are no longer a meaningful threat to the Fed’s 2% inflation target, as growth in the labor force has coincided with fading demand for workers. Meantime, downward pressure on price growth from weakening consumer demand is mounting and driving inflation for discretionary items back to its 2019 pace. While the year-over-year rate of core PCE inflation is likely to remain stuck around its current rate through the end of the year, the annualized pace of inflation looks set to ease back in-line with the FOMC’s target. Amid increasingly worrisome conditions in the labor market, we expect the Fed to consider inflation is close enough to its target and embark on a rate cutting cycle at its next meeting.
July CPI Poised for Another Tame Increase
Weakening in the jobs market may have finally stolen the spotlight from inflation, but the extent to which the FOMC reacts to the dimming labor picture depends in part on how price data unfold from here. The past two months of inflation prints have shown that the downward trend in price growth is back on track after the first quarter’s derailment. The July CPI report is likely to further the case that inflation is quieting down even if it has not yet returned to the Fed’s target.
We estimate headline CPI rose 0.2% in July, which would keep the 12-month change steady at a more than a three-year low of 3.0%. Although gasoline prices rose a little over 1% during the month, grocery store prices were likely little changed amid more stable input prices and rising promotional activity.
Excluding food and energy, we also look for a tame 0.2% increase, even as that would mark a slight pickup relative to June (Figure 1). If realized, the year-over-year rate of core inflation would edge down to 3.2%, with the three-month annualized rate of 1.6% pointing to a further moderation in the 12-month change ahead. Goods prices are likely to decline another 0.1% in July. However, there are tentative signs that outside of autos, goods deflation is losing steam, with the year-over-year rate of “other” core goods starting to turn higher.
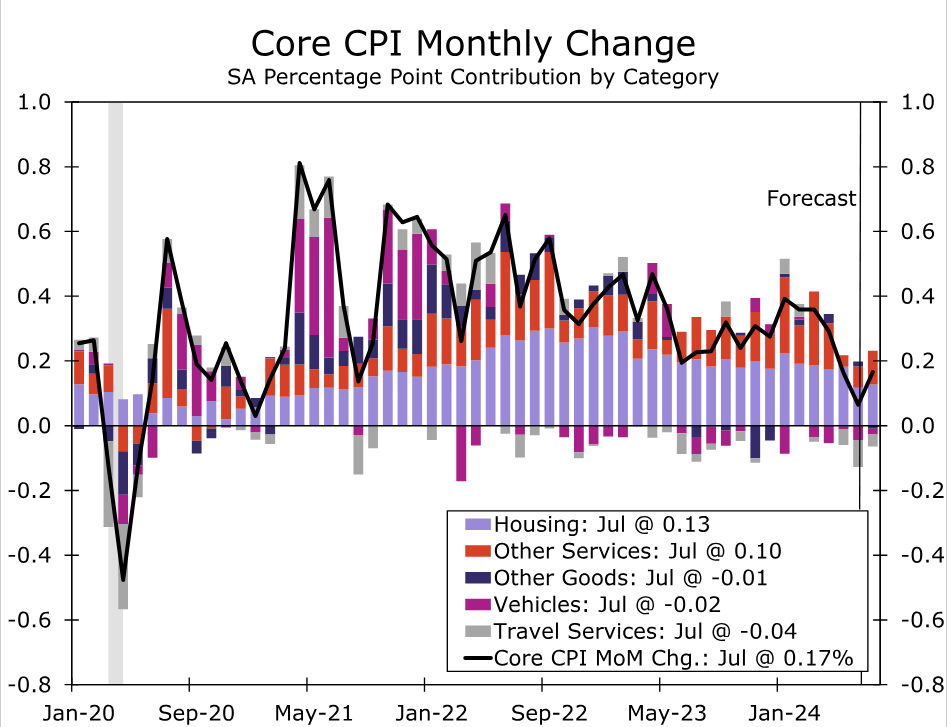
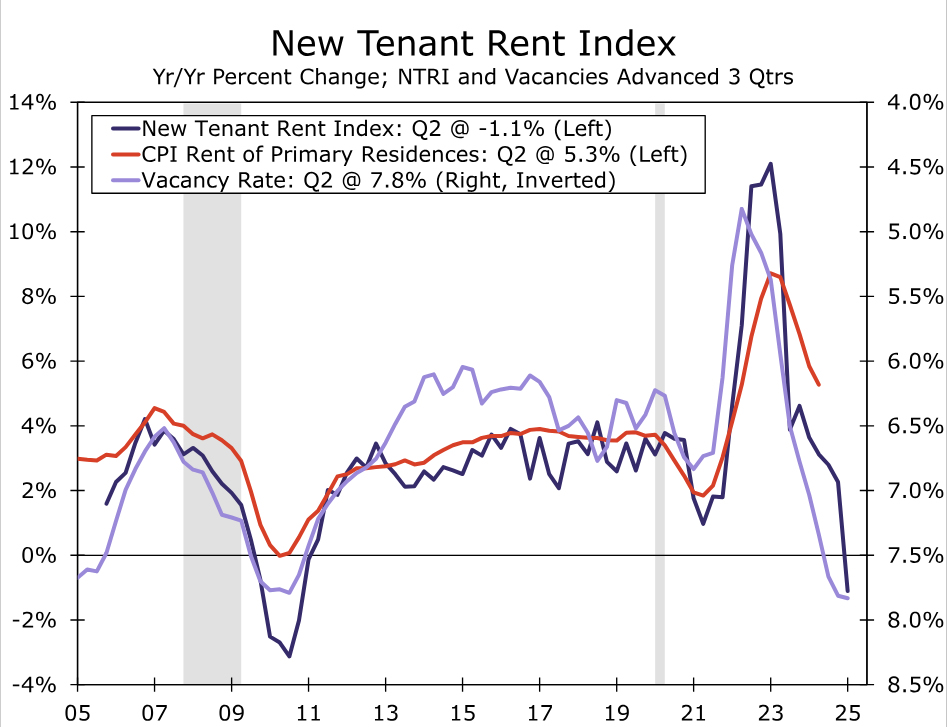
With core goods inflation already running below its pre-pandemic pace, more material cooling in services is needed to continue to drive core inflation lower. Core services prices look to have advanced more quickly in July relative to June, but the 0.25% increase we have penciled in would still be noticeably below the 0.40% average monthly increase over the first six months of the year. We anticipate July’s monthly pickup to be driven by the “super core” after June’s sharp drop in the volatile travel services category and a below-trend rise in medical care services. However, June’s downshift in primary shelter looks to be sustainable based on the BLS’s New Tenant Rent Index and private sector vacancies (Figure 2). We look for another 0.3% rise in July and for primary shelter to increase 0.25%–0.30% per month through the end of the year.
Seasonal factors also look be supportive of keeping core CPI in check for July, although to a smaller extent than was the case in June. Prices during the month of July the past five years have risen nearly in line with the full calendar year average change in prices, whereas in the years preceding the pandemic, the month of July tended to see below-average price increases. If the calendar-year timings of price adjustments are moving back to their pre-pandemic patterns, the moderating trend in inflation could be flattered by the seasonal factor “expecting” a larger increase. While this dynamic may make for a more favorable monthly print in July, the reverse of this dynamic looks set to occur in September and push up the monthly reading somewhat.
Diminished Pricing Power to Push Inflation Down
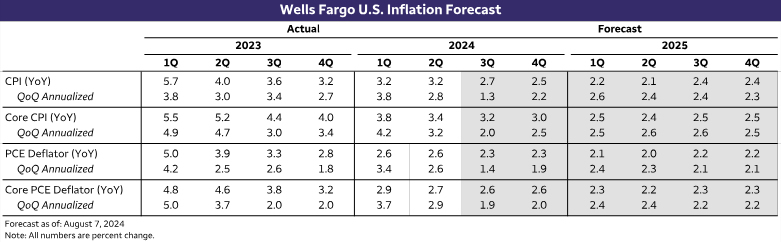
Looking further ahead, inflation should continue to subside on trend in the coming quarters, even as it remains modestly above the Fed’s target (Figure 3). The supply-side of the economy may not be healing as quickly as in 2022 or 2023, but the disinflationary impact of earlier improvement is still working its way to consumer prices. Goods and services providers alike are experiencing slower growth in employment costs. Unit labor costs are running below 2%, highlighting how the state of the labor market is no longer a threat to the Fed’s inflation target. And while services inflation has been slower than goods inflation to cool, just as it was slower to take off, it should benefit from more subdued cost growth in physical inputs, as goods inflation is now running below its pre-pandemic pace.
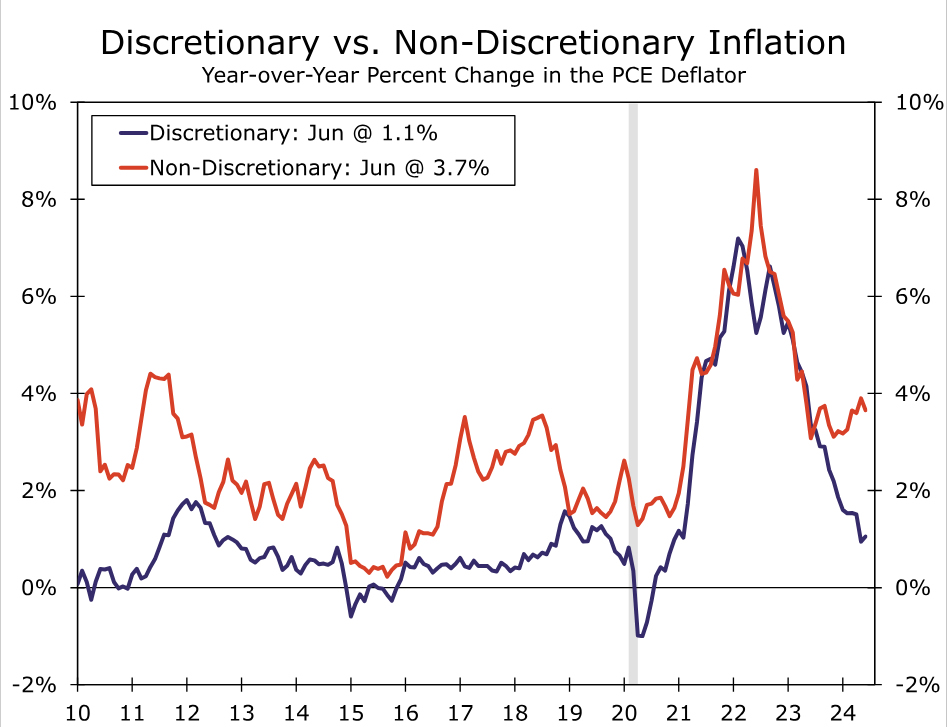
Meantime, downward pressure on price growth from softer demand is mounting. Consumers are not the price-takers they were earlier in the post-pandemic recovery. Anecdotal evidence from the Fed’s Beige Book underscores diminished pricing power of firms; the national summary in the July report points out that “almost every District mentioned retailers discounting items or price-sensitive consumers only purchasing essentials, trading down in quality, buying fewer items, or shopping around for the best deals.” The growing reluctance to shell out for discretionary purchases is showing up in price growth. Over the past year, inflation related to discretionary goods and services has fallen back into line with its 2019 average (Figure 4).1 Non-discretionary inflation should ease somewhat further as slower rent growth over the past two years is finally captured by the official data.
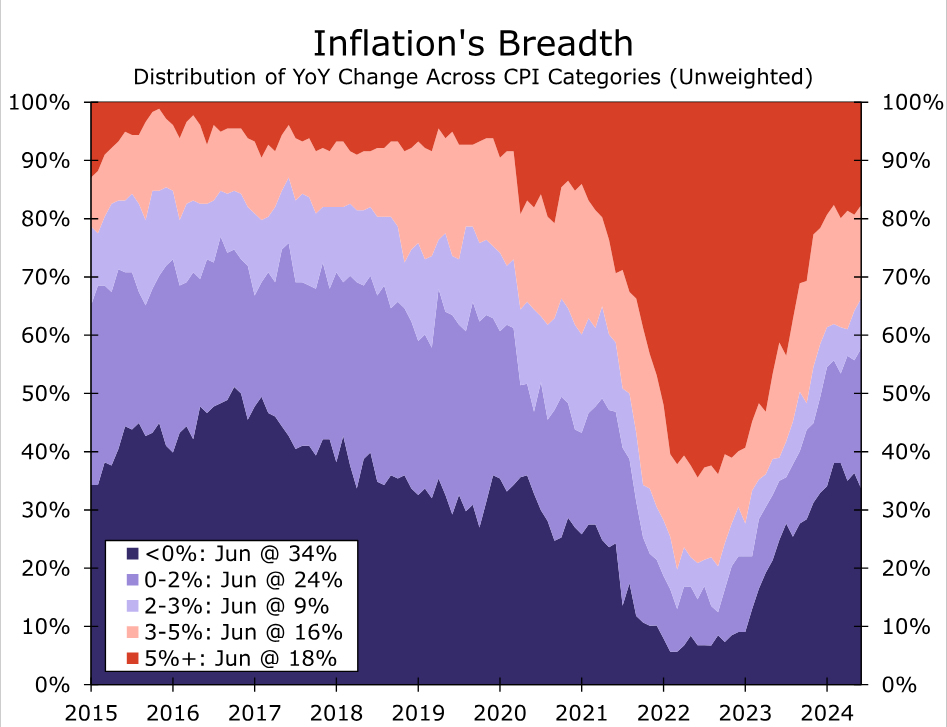
Amid supply-side improvements and growing price-sensitivity among consumers, disinflation has become more broad-based. Price growth in 58% of CPI categories has slowed below 2% year-over-year compared to 35% a year ago (Figure 5), while the Median CPI is up at a three-month annualized rate of 3.2%—its slowest pace since inflation took off in the spring of 2021. Broadening disinflation is also evident within the Fed’s preferred PCE deflator. The Trimmed Mean PCE index continued to moderate on a year-over-year basis in June even as the traditional core index was unchanged at 2.6%.
We look for inflation to trudge lower in the months ahead. Improvement is likely to be more evident in the Consumer Price Index than the PCE deflator due to the CPI’s larger weighting of shelter inflation and motor vehicle insurance.2 However, while the year-over-year rate of core PCE inflation is likely to remain stuck around its current rate through the end of the year, the annualized pace of inflation looks set to ease back in-line with the FOMC’s target (refer back to Figure 3). Amid increasingly worrisome conditions in the labor market, we expect the Fed to consider inflation is close enough to its target and embark on a rate cutting cycle at its next meeting.
Endnotes
1 – Our definition of non-discretionary spending categories includes food & non-alcoholic beverages for off-premises consumption; gasoline & other energy goods; pharmaceutical & other medical products; therapeutic appliances & equipment; housing & utilities; health care services; financial services & insurance; and communication services. These categories of spending represent about 55% of all personal consumption, with the remaining 45% of all other goods and services spending making up discretionary spending.
2 – In addition to a larger weighting of motor vehicle insurance in the CPI relative to the PCE deflator, the pricing differences in the two indices mean a sustained step down in price growth of motor vehicle premiums will show up more prominently in the CPI. In the CPI, insurance costs reflect the premiums paid by consumers, but not claims paid out by insurers on behalf of motorists. The PCE’s net-revenue approach has contributed to motor vehicle insurance prices rising less dramatically since insurers’ costs to cover claims have risen rapidly alongside higher vehicle repair and replacement costs.