
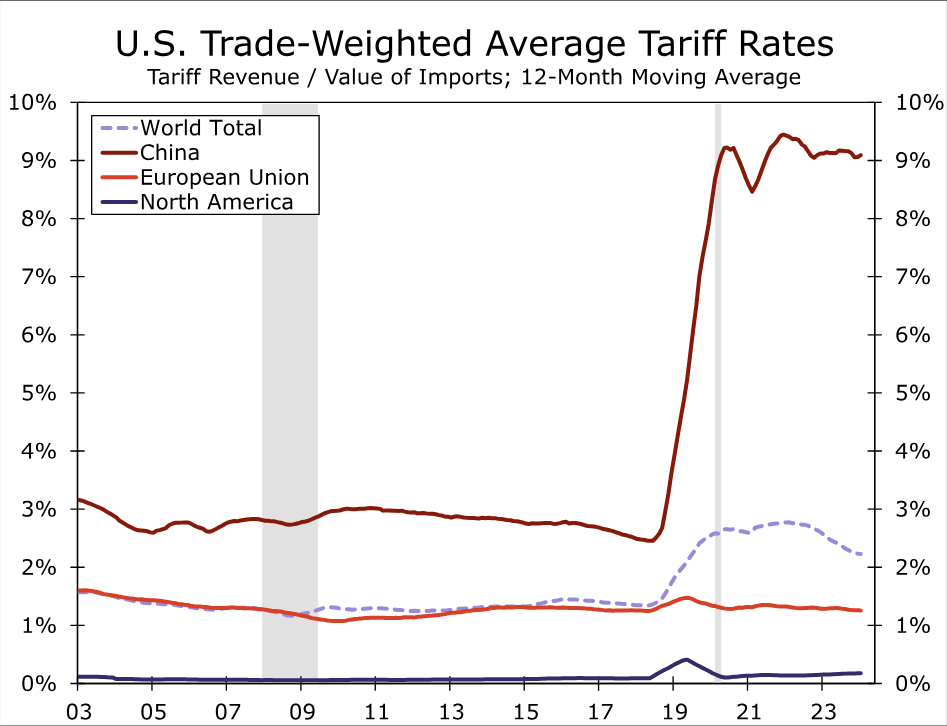
. Moreover, the loss of nearly six million manufacturing jobs in the first decade of the current century, which some observers associated with a flood of imports, also stoked public consciousness of trade policy issues. President Trump raised tariffs on many of America's trading partners starting in 2018. The effective tariff rate on imports from China, which had been less than 3%, jumped to about 9% (Figure 2).)
Summary
- President Biden recently hiked tariffs on $18 billion worth of imports from China, and former President Trump has vowed to implement a 60% tariff on China and an across-the-board 10% tariff on other trading partners should he return to the White House in 2025. What effects would these tariff increases have on the U.S. economy?
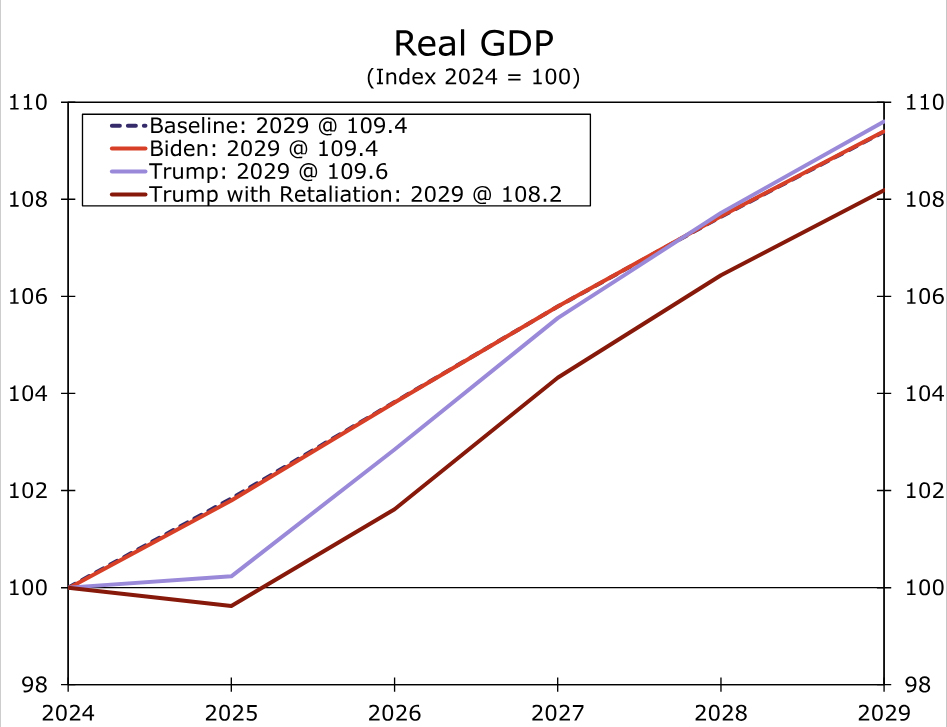
- Using a large macroeconomic model, we analyze four scenarios. The “baseline” scenario, in which tariffs are not raised, traces out the path of the economy from 2025 through 2029. We impose a 50% tariff on $18 billion worth of Chinese imports under the “Biden” scenario. In the “Trump” scenario we impose a 60% tariff on imports from China and an across-the-board 10% tariff on other trading partners. In the fourth scenario, we repeat the analysis of the “Trump” scenario but assume that foreign economies retaliate with their own 10% tariff on imports of American-made products.
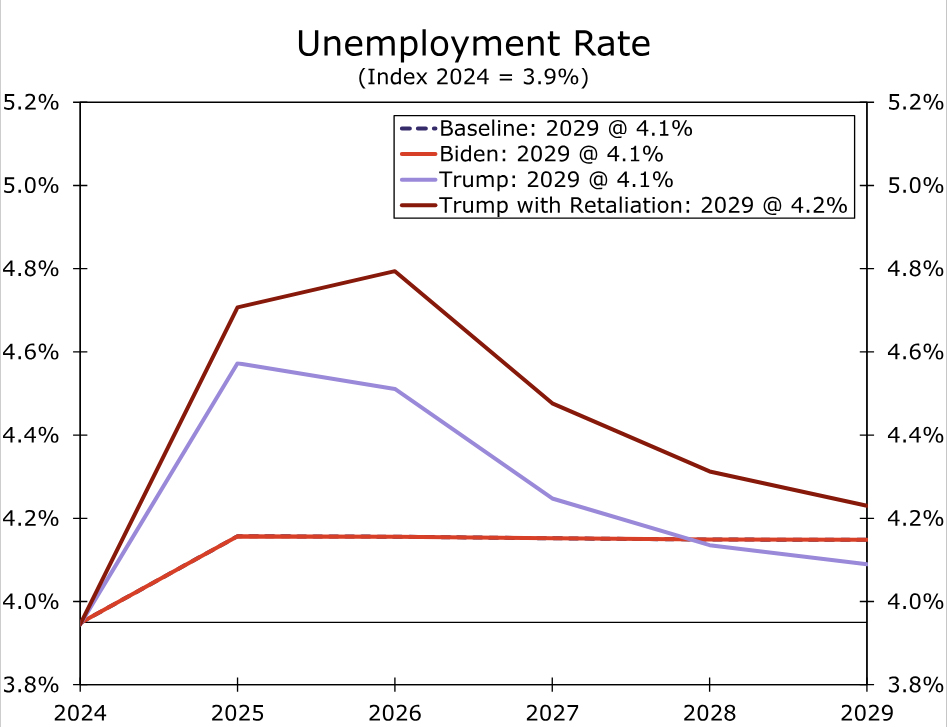
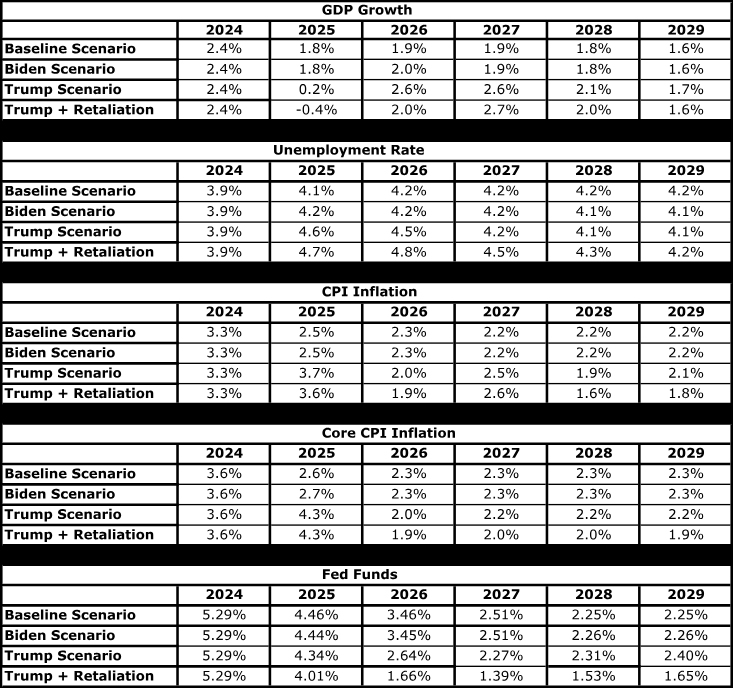
- The “Biden” scenario is essentially the same as baseline because tariffs on only $18 billion of Chinese imports simply do not move the needle in a $28 trillion economy. Under the “Trump” scenario, GDP growth downshifts significantly in 2025 relative to baseline, which causes the unemployment rate to rise half a percentage point more. Inflation is higher in 2025 under the “Trump” scenario relative to the baseline. If foreign countries retaliate with their own levies, then our projections show that U.S. GDP would contract next year and the jobless rate would move even higher.
- The growth-reducing effects of the tariffs arise from their effects on the Consumer Price Index. Higher prices erode growth in real income, which leads to slower growth in real consumer spending. Monetary policy easing helps to cushion the blow to the real economy from the tariffs. That said, Fed policymakers may place greater weight on deviations of inflation from target than the model assumes. If so, real GDP growth could slow more and the jobless rate could rise higher than our simulation results suggest.
- The so-called “Misery Index,” which is the sum of the CPI inflation rate and the unemployment rate, rose from 9% in 1972 to more than 20% in 1980 due to the oil price shocks of the 1970s. The unemployment rate and the inflation rate would both increase if tariffs rise meaningfully, but the sum of these two variables likely would remain well-below the highs that were reached in the late 70s/early 80s. In short, tariff increases would impart a modest stagflationary shock to the economy.
American Political Economy: Turning Away from Free Trade
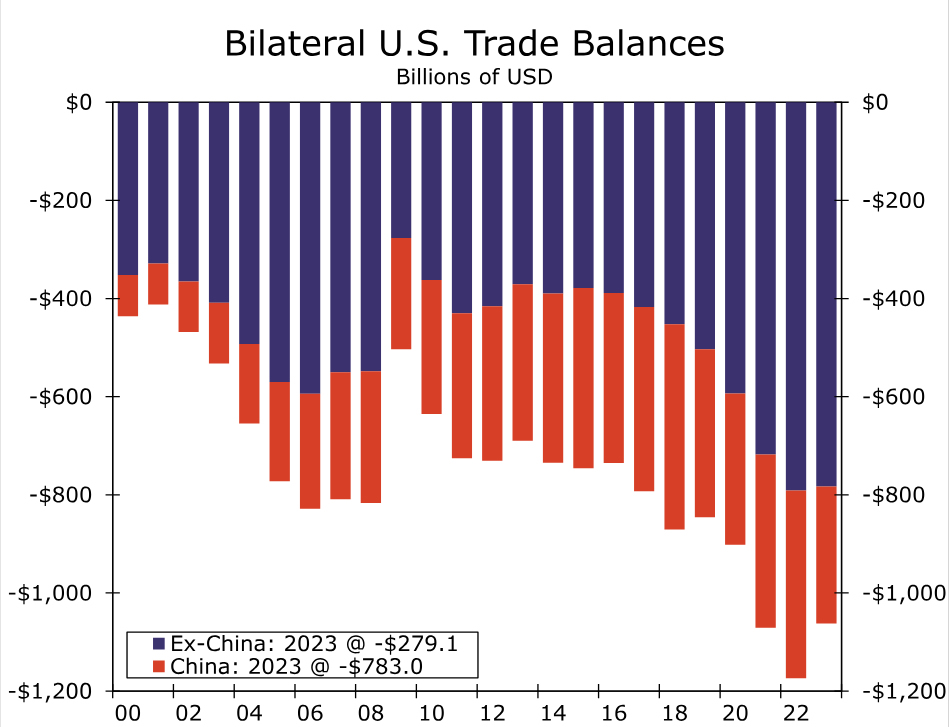
International trade issues, which were largely absent from the U.S. political economy in the early years of the 21st century, have come to play a more important role in recent years. America’s persistent trade deficits, especially the large bilateral deficit with China, have served as the backdrop for the renewed attention to international trade issues (Figure 1). Moreover, the loss of nearly six million manufacturing jobs in the first decade of the current century, which some observers associated with a flood of imports, also stoked public consciousness of trade policy issues. President Trump raised tariffs on many of America’s trading partners starting in 2018. The effective tariff rate on imports from China, which had been less than 3%, jumped to about 9% (Figure 2).
President Biden subsequently rescinded the Trump tariffs on non-Chinese trading partners, but he largely kept in place the existing tariffs on Chinese goods. More recently, the president announced on May 14 that he was raising tariffs on roughly $18 billion worth of imports from China. The affected products include steel and aluminum, semiconductors, electric vehicles, batteries, solar cells, ship-to-shore cranes and some medical products. The new tariff rates on these products range from 25% to 100%. Should former President Trump regain the White House in this year’s presidential election, he has vowed to enact an across-the-board 10% tariff on all imports and would raise the tariff rate on Chinese imports to 60%. What impact will the new tariffs announced by President Biden, and the threatened ones by former President Trump, have on the U.S. economy?
Tariffs Would Lead to Slower Growth in 2025 and Higher Unemployment
Using a large macroeconometric model, we consider four different scenarios. The first scenario is the baseline forecast under the assumption of no new tariffs. In the second scenario, which we label “Biden,” we consider the effect of a 50% tariff on $18 billion worth of Chinese imports.1 We shock the model with the new tariffs starting in Q3-2024 and hold them at their higher rates through 2029 (the end of the model’s forecast period). Under the “Trump” scenario, we analyze the effects of a 60% tariff on the total value of Chinese imports and a 10% tariff on America’s other trading partners beginning in 2025.2 In the fourth scenario, which we label “Trump + retaliation,” we repeat the analysis of the third scenario but add a 10% retaliatory tariff on U.S. exports to America’s trading partners. Considering that many foreign economies levied their own tariffs on American products in 2018 and 2019, prospects of retaliatory tariffs by trading partners in future years, should the United States announce its own levies, are not unrealistic.
The effects of the different scenarios on the level of real GDP and the unemployment rate are shown in Figure 3 and Figure 4, respectively. (Full numerical results are shown in the appendix.) Under the baseline scenario (i.e., no tariff increases), real GDP rises by a cumulative amount in excess of 9% between 2024 and 2029. The unemployment rate edges up to 4.2% by 2026, and then stays at that rate through the end of the forecast period. The “Biden” scenario is essentially identical to the baseline scenario because the recently announced tariff increases are levied on only $18 billion of Chinese imports. With American imports of goods totaling roughly $3 trillion in 2023 and with the U.S. economy producing roughly $28 trillion of nominal GDP last year, tariffs on only $18 billion of imports simply do not have a marked effect on major U.S. macroeconomic variables.
Under the “Trump” scenario (i.e., 60% tariffs on China, 10% tariffs on the rest of America’s trading partners), real GDP is essentially flat in 2025 whereas it grows 1.8% under baseline (Figure 3). The downshift in growth causes the unemployment rate to rise to 4.6% (Figure 4). As GDP growth strengthens in subsequent years, the jobless rate recedes back to its baseline rate. Under the scenario in which America’s trading partners retaliate against the Trump tariffs with their own 10% levies on U.S. exports, real GDP would contract by 0.4% in 2025. Growth turns positive again in 2026, due in part to the monetary policy easing that we discuss in more detail below, but the level of GDP (i.e., the size of the economy) does not return to baseline, at least not through 2029. The jobless rate under the “Trump + retaliation” scenario rises to 4.8% in 2026 before subsequently receding.
Tariffs Raise Inflation in 2025
The growth-reducing impact of the tariffs arise from their effects on the Consumer Price Index (CPI). As shown in Figure 5, the CPI rises by 2.5% in 2025 under the baseline scenario (as well as under the “Biden” scenario). But the 60% tariffs on Chinese goods and the 10% tariffs on imports from other trading partners that underlie the “Trump” scenario causes the CPI to jump 3.7% in 2025. In short, the tariffs lead to higher inflation, at least initially. The higher rate of inflation erodes growth in real disposable income, which has a depressing effect on growth in real consumer spending. As shown in the appendix, the core rate of CPI inflation, which excludes food and energy prices, exceeds the overall rate of inflation in 2025 under both the “Trump” and the “Trump + retaliation” scenarios. The tariffs, which act as a tax on foreign exports to the United States, lead to slower growth in foreign economies, thereby putting downward pressure on the price of oil.
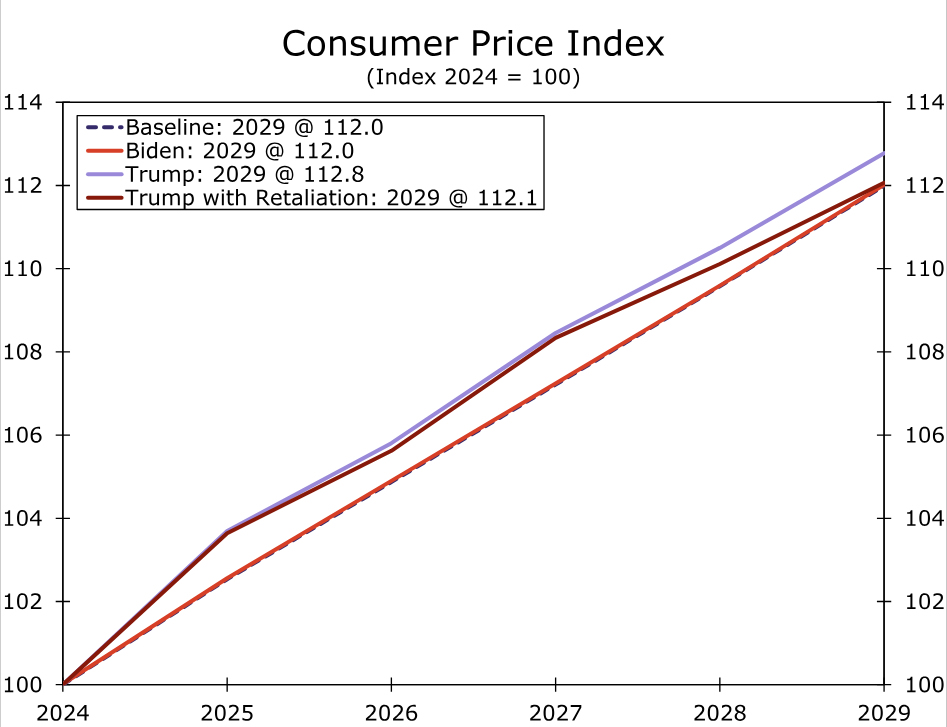
The Trump tariffs (60% on China, 10% on other trading partners) raise core consumer prices in 2025 by 1.6% relative to the baseline. The relatively modest increase in consumer prices is consistent with the empirical literature. For example, Cavallo et al. (2021) found that the vast majority of the 2018-19 tariff increases were paid for by U.S. importers.3 (That is, foreign exporters did not reduce their prices in an attempt to maintain market share in the United States.) Although American importers passed on some of the higher costs of the tariffed goods to consumers via higher prices, the importers absorbed the remainder via lower margins. We noted in a recent report that corporate profit margins are healthy at present, so importers may choose again to absorb some of the higher cost of foreign goods, should they be tariffed, via lower margins. That noted, prolonged margin squeeze could eventually lead to job cuts in the affected industries.
In our view, the GDP growth rates in 2025 and 2026 that are estimated by the model under the “Trump” and the “Trump + retaliation” scenarios could be best-case outcomes. As shown in Figure 6, the model estimates that the Federal Reserve would cut the target range for the federal funds rate by more under the two Trump scenarios than it does under the baseline scenario. These outcomes reflect the model’s assumption that Fed policymakers place nearly equal weights on deviations of inflation from target as they do on the output gap. The output gap, which measures deviations of actual GDP from potential GDP, is highly correlated with the unemployment rate (i.e., the jobless rate goes up as actual output falls farther below potential output and vice versa). In other words, the model uses the so-called Taylor Rule with essentially equal weights on inflation and the output gap as a proxy for the Fed’s reaction function.
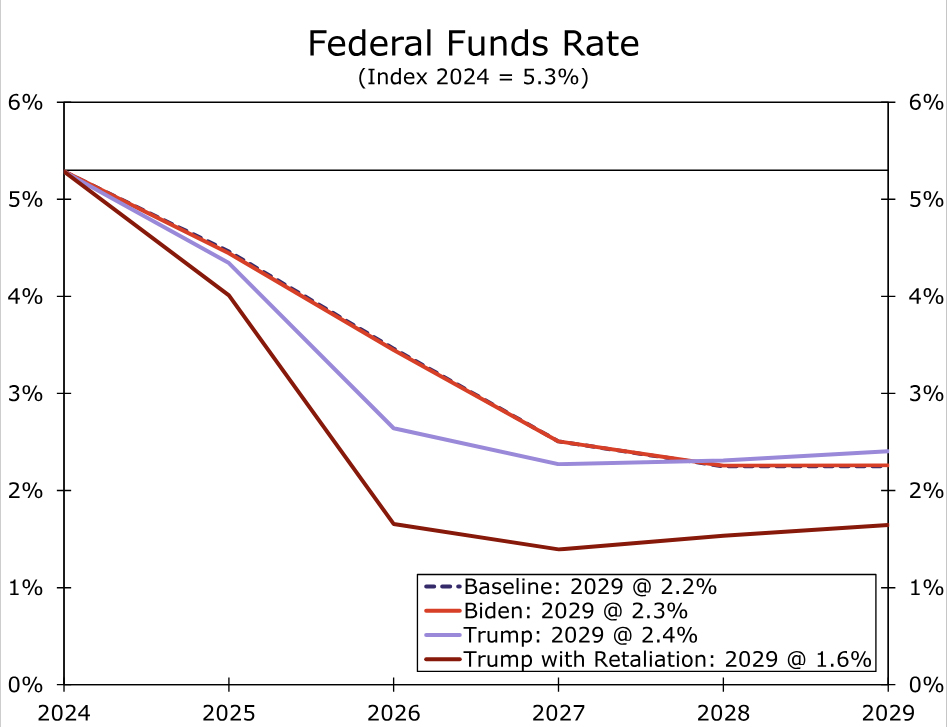
In the past, Fed policymakers seem to have placed equal weights on deviations of inflation from their 2% target as they did on the output gap. But given the surge in inflation a few years ago and the FOMC’s determination to return it to target, one could reasonably argue that Fed policymakers actually place a greater weight on inflation at present than they do on the unemployment rate/output gap. If the levying of tariffs causes inflation to jump higher, then the FOMC may not cut rates as aggressively as the model estimates. Consequently, real GDP likely would weaken even more under the two Trump scenarios, thereby leading to a higher unemployment rate than shown in Figure 4.
Modest Stagflationary Shock from Higher Tariffs
In short, across-the-board tariffs on America’s trading partners would impart a modest stagflationary shock to the U.S. economy. That said, the model results suggest that the simultaneous rise in the unemployment rate and the inflation rate would not approach the degree of stagflation that was experienced in the late 1970s and 1980s. The so-called “Misery Index,” which is the sum of the CPI inflation rate and the unemployment rate, shot up from roughly 12% in September 1973, which immediately preceded the first oil price shock, to about nearly 20% in early 1975 (Figure 7). It receded over the next few years but surged again to more than 20% following the second oil price shock in early 1979. As shown in the appendix, the combination of the annual CPI inflation rate and the annual unemployment rate remains below 10% in both the “Trump” and the “Trump + retaliation” scenarios. Even if higher inflation leads to less monetary easing than the model assumes, which would cause the jobless rate to rise higher than shown in the appendix, we doubt the “Misery Index” would approach the levels that were registered in the late-70s/early-80s.
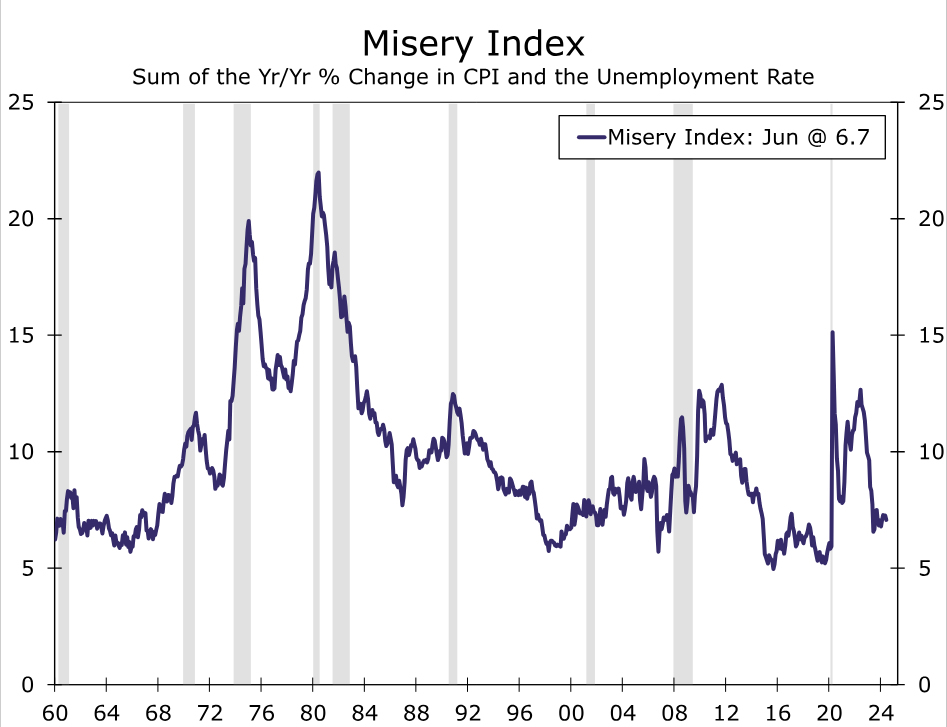
The stagflation of that earlier era was kicked off by the oil price shocks of 1973 and 1979. The price of oil shot up 150% between Q3-1973 and Q1-1974. After grinding steadily higher over the next few years, oil prices jumped another 150% between early 1979 and mid-1980. Because oil was a widely used input in the U.S. economy at that time—not only did motorists use oil products but homes and factories were heated by oil—the oil price shocks had a significant stagflationary effect.
Fast-forward a few decades. The value of goods imports is equivalent to only 11% of nominal GDP at present, and the price rises induced by the potential tariffs pale in comparison to the moonshot in oil prices in the 1970s. We are not suggesting that the effects of the proposed tariff increases are de minimis. Higher prices erode growth in real income, which causes real GDP growth to slow, if not contract. The unemployment rate would rise. In short, the tariff increases would impart a modest stagflationary shock to the economy. However, a redux of the 1970s and early 1980s probably would not occur unless the Federal Reserve allowed inflation expectations to become unmoored. Given the Fed’s well-earned inflation fighting credentials of the past few decades, we believe such a scenario is not very likely.
Appendix
Endnotes
1 – As noted previously, the Biden tariffs range from 25% to 100%. We use 50% in our modeling exercise as a simplifying assumption. (Return)
2 – The model’s parameters allow us to consider the effects of tariffs on American imports from only Canada, China, the European Union, Japan, Korea and Taiwan. That noted, these economies in aggregate account for roughly 70% of total U.S. imports of goods. (Return)
3 – Cavallo, Alberto, Gita Gopinath, Brent Neiman and Jenny Tang, “Tariff-Pass Through at the Border and at the Store: Evidence from US Trade Policy,” American Economic Review: Insights 3:1, 2021, p. 19-34. (Return)