- Thursday’s UK elections expected to bring political change
- Similar developments in both 1997 and 2010 weighed on the pound
- History points to a significant easing in pound volatility across the board
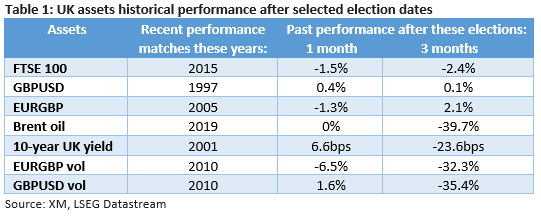
- Recent FTSE 100 performance matches the 2015 pre-election moves
General election in sight
The UK general election will be held this Thursday, July 4, the day that the US will be celebrating its 248th anniversary from the adoption of the Declaration of Independence. The Labour party is expected to comfortably win the elections with the last unanswered question being the size of its parliamentary majority. It could win more than 400 seats in the next parliament, the biggest Labour majority since 2001, giving its leader the ability to govern untroubled over the next 5 years.
The market has understandably analysed and dissected the economic plans of the new government, but it appears to be in a waiting mode ahead of such an important event. The FTSE 100 index is around 3% lower since the May 22 announcement day while the pound has had a mixed performance against both the dollar and the euro, despite the increased market volatility.
What’s next for key UK assets?
Historical analysis is a useful way of mapping the possible market reaction following risk events. Therefore, a detailed look at the post-election performances since 1997 could be interesting. However, one has to take into consideration that external developments, like the euro area debt crisis, or one-off events, like Brexit, could gravely affect the outcome of the elections and the market reaction.
1997 and 2010 – a repeat of history?
Having said that, there are two elections that stand out and match the current setup. In 1997, the Labour Party under Tony Blair managed to reclaim the government after 18 years of Conservative dominance. Similarly, in 2010, the Tories returned to power, winning four consecutive elections and staying in charge until July 4, 2024. So, what happened to the key market assets before and after these elections?
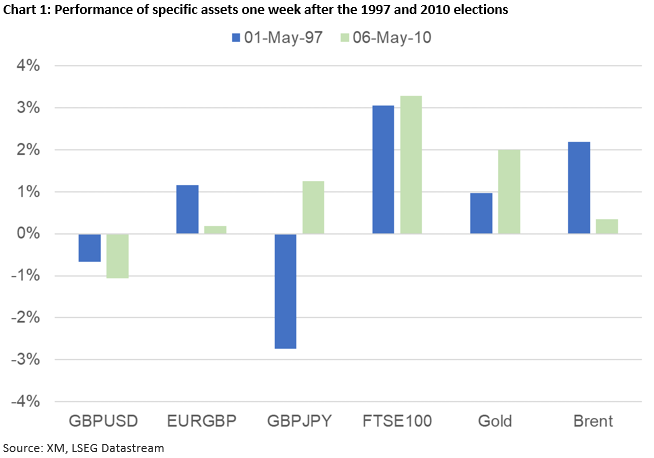
An analysis of the market’s performance on the day of the election, one day and one week after the key dates reveals some interesting findings. For example, Brent oil prices tend to drop both on the day of the elections and on the following day as the markets are still digesting the outcome.
More importantly, market changes one week after the election give the strongest signals. As seen in chart 1 below, in both 1997 and 2010, the pound underperformed against both the US dollar and the euro, while the FTSE 100 index jumped by around 3%. Additionally, both gold and Brent oil prices show a tendency to rise, with the latter greatly affected by the new energy initiatives expected to be implemented by the new government.
Volatility in the last four elections
Another popular way of trading significant market events is through volatility. Analysis of the one-month implied volatility for both the euro/pound and pound/dollar pairs in the last four elections, since 2010, shows some promising results.
Volatility in both pairs tends to drop one day after the elections are held, with the sole exception of 2010 when the unfolding euro area debt crisis caused a small increase in one-month volatility. Interestingly, this correction in currency volatility persists one week after the election date with drops of around 10-35% recorded in the past four elections, as the market reacts to the lower political risk. This easing in volatility is also maintained when examining longer time periods, up to six months after the election dates.

Could the recent performance give us hints on the short-term outlook?
Finally, an alternative way of analysing historical trends is to try and match the pre-event performance of the key assets during previous elections with the current one. The logic behind this process is that similar performances point to similar risks priced in both periods and could thus reveal the short-term outlook for the analysed assets.
Table 1 below shows the matched election periods for the various assets. For example, this year’s price action of the FTSE 100 index matches the pre-election performance of the index before the 2015 elections, when the Tories won another term in the government. In 2015, the FTSE 100 was 1.5% down one month after the election date with its losses increasing to 2.4% in the three-month period.