
Bearish scenario: Sell below 0.6597 with TP1: 0.6587, TP2: 0.6579, and TP3: 0.6558, with an S.L. above 0.6611 or at least 1% of account capital.
Bullish scenario: Buy above 0.6611 with TP1: 0.6626 and TP2: 0.6646, with an S.L. below 0.6597 or at least 1% of account capital. Apply a trailing stop.
Fundamental Analysis
The fundamental analysis of the AUDUSD pair is influenced by several key factors:
- USD Strength: The US dollar has strengthened due to robust US employment data, which reduces the likelihood of interest rate cuts by the Federal Reserve this year.
- RBA Policy: The Australian dollar might find support as the Reserve Bank of Australia (RBA) plans to keep interest rates high to control inflation. The RBA is willing to increase rates if inflation does not fall within the target range of 1% to 3%.
- Fed Expectations and US Inflation Data: The market will be focused on the Fed’s decision and the US inflation data to be released on Wednesday, June 11, 2024. The Fed is expected to maintain current rates to bring inflation down to its 2% target, with May’s annual CPI projected to increase by 3.4% overall and 3.5% for the core CPI, excluding food and energy.
These factors create an environment where the strength of the USD and the monetary policies of both the RBA and the Fed are crucial in determining the movement of the AUDUSD pair.
Technical Analysis
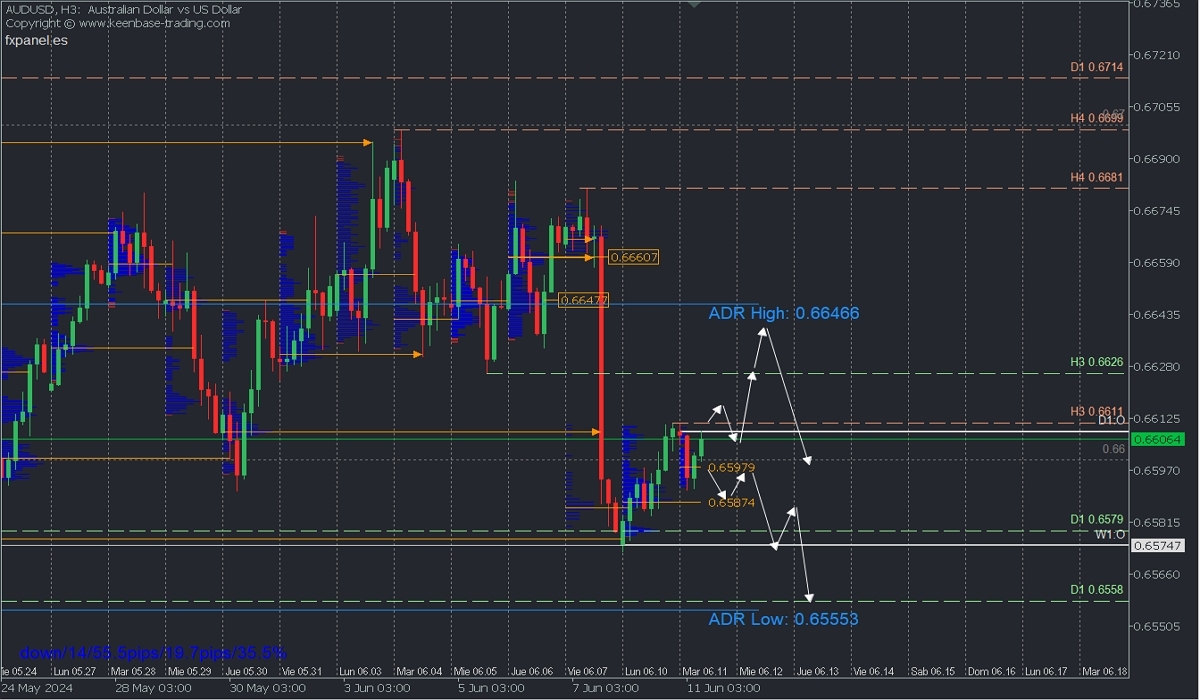
Average Daily Range High (ADR High): 0.6646// Average Daily Range Low (ADR Low): 0.6555
Supply Zones (sell zones): 0.6608 / 0.6647// Demand Zones (buy zones): 0.6597 / 0.6587
After better-than-expected US employment data on Friday, the pair dropped more than 1.5%, now establishing two contiguous demand zones around 0.6587, which triggered a push towards the broken zone at 0.6608. Therefore, two potential intraday scenarios are proposed:
Bullish Extension:
This scenario will be confirmed after a decisive break above Monday’s resistance at 0.6611, targeting the 0.6626 level and the extended daily bullish average range at 0.6646, filling the volume gap left by Friday’s rapid decline. From there, new sell positions can be considered. This scenario will be invalidated with prices below the demand zones between 0.6597 and 0.6587.
Bearish Continuation:
If the price fails to break the 0.6611 resistance and subsequently breaks below the Asian session demand zone at 0.6597, it points to selling towards Monday’s uncovered POC at 0.6587. A decisive break on a second touch indicates bear dominance, leading to a decline towards the weekly opening zone at 0.6574 and, more extended, the support at 0.6558, close to the average daily bearish range.
*Uncovered POC: POC = Point of Control: This is the level or zone where the highest volume concentration occurred. If there was a previous bearish movement from it, it is considered a sell zone forming a resistance area. Conversely, if there was a previous bullish impulse, it is considered a buy zone, usually located at lows, thus forming support zones.