
 to 4.75% due to signs of cooling inflation in Canada. This decision will highlight the monetary policy divergence between the BoC and the Fed, potentially boosting the USD.)
- Bullish Scenario: Buy above 1.3676 with TP1: 1.3699, TP2: 1.3720, and TP3: 1.3735, with an SL below 1.3665 or at least 1% of account capital. Apply trailing stop.
- Bearish Scenario: Sell below 1.3665 with TP1: 1.3623, with an SL above 1.3686 or at least 1% of account capital.
Fundamental Analysis
The BoC has maintained its official interest rate at 5.0% since July 2023, and markets expect it to cut its overnight rate by 25 basis points (bps) to 4.75% due to signs of cooling inflation in Canada. This decision will highlight the monetary policy divergence between the BoC and the Fed, potentially boosting the USD.
On the US side, recent PCE inflation data, ISM manufacturing PMI, and employment surveys below expectations have increased speculation that the Fed will need to cut rates at least once between September and December to sustain economic growth.
Technical Analysis
USDCAD
- Average Daily Range High (ADR High): 1.3730
- Average Daily Range Low (ADR Low): 1.3619
- Supply Zones (sell): 1.3720 / 1.3735
- Demand Zones (buy): 1.3627
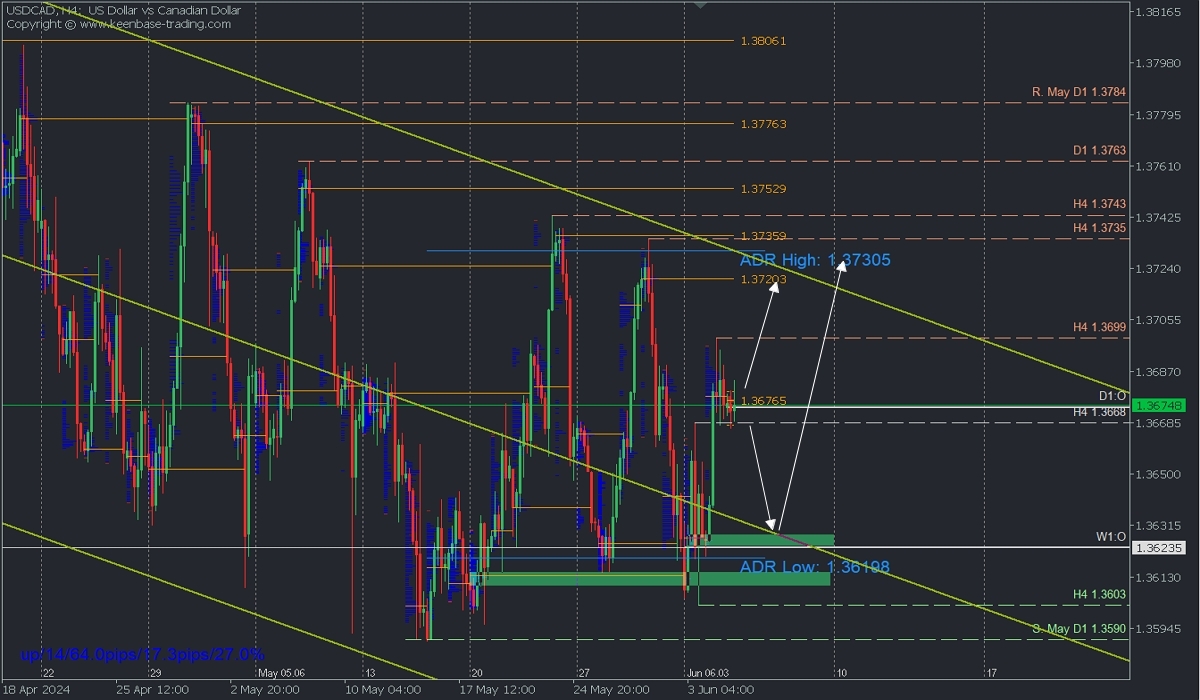
Price consolidation above macro demand zones and in the positive territory of a linear regression channel from April highs suggest a bullish scenario.
Bullish Continuation:
This scenario will be considered with quotes above the daily open and the Asian POC at 1.3676, targeting a break of resistance at 1.3690 towards the supply zone between 1.3720 and 1.3735. This indicates a strengthening of the bulls aiming to renew the uptrend seen in early April.
Bearish Extension:
A pullback below 1.3668 towards the midpoint of the regression channel, coinciding with a volume node from yesterday’s ascent around 1.3637, is not ruled out before the BoC rate announcement. The bullish momentum is preserved if quotes do not break the demand zone at the weekly open of 1.3623. If this level is breached, selling could extend towards the next demand zone at 1.3613, potentially challenging the key support at 1.3603.
POC Explained: POC = Point of Control: It is the level or zone where the highest concentration of volume occurred. If there was a previous downward movement from this level, it is considered a sell zone and forms a resistance area. Conversely, if there was a previous upward movement, it is considered a buy zone, usually located at lows, forming support zones.