
, stronger than Westpac’s forecast for +20k and the market consensus for +23.7k. That follows a fairly volatile opening quarter, with gains ranging from +11.6k in January, to +118.2k in February and –5.9k in March. On a three-month average basis, annual employment growth has held broadly steady at 2.8%yr over the past four months. Still, employment’s current pace remains stronger than 2.0%yr to 2.5%yr ‘norm’ observed in the years prior to the pandemic.)
Employment: +38.5k (from –5.9k). Unemployment Rate: 4.1% (from 3.9%). Participation Rate: 66.7% (from 66.6%).
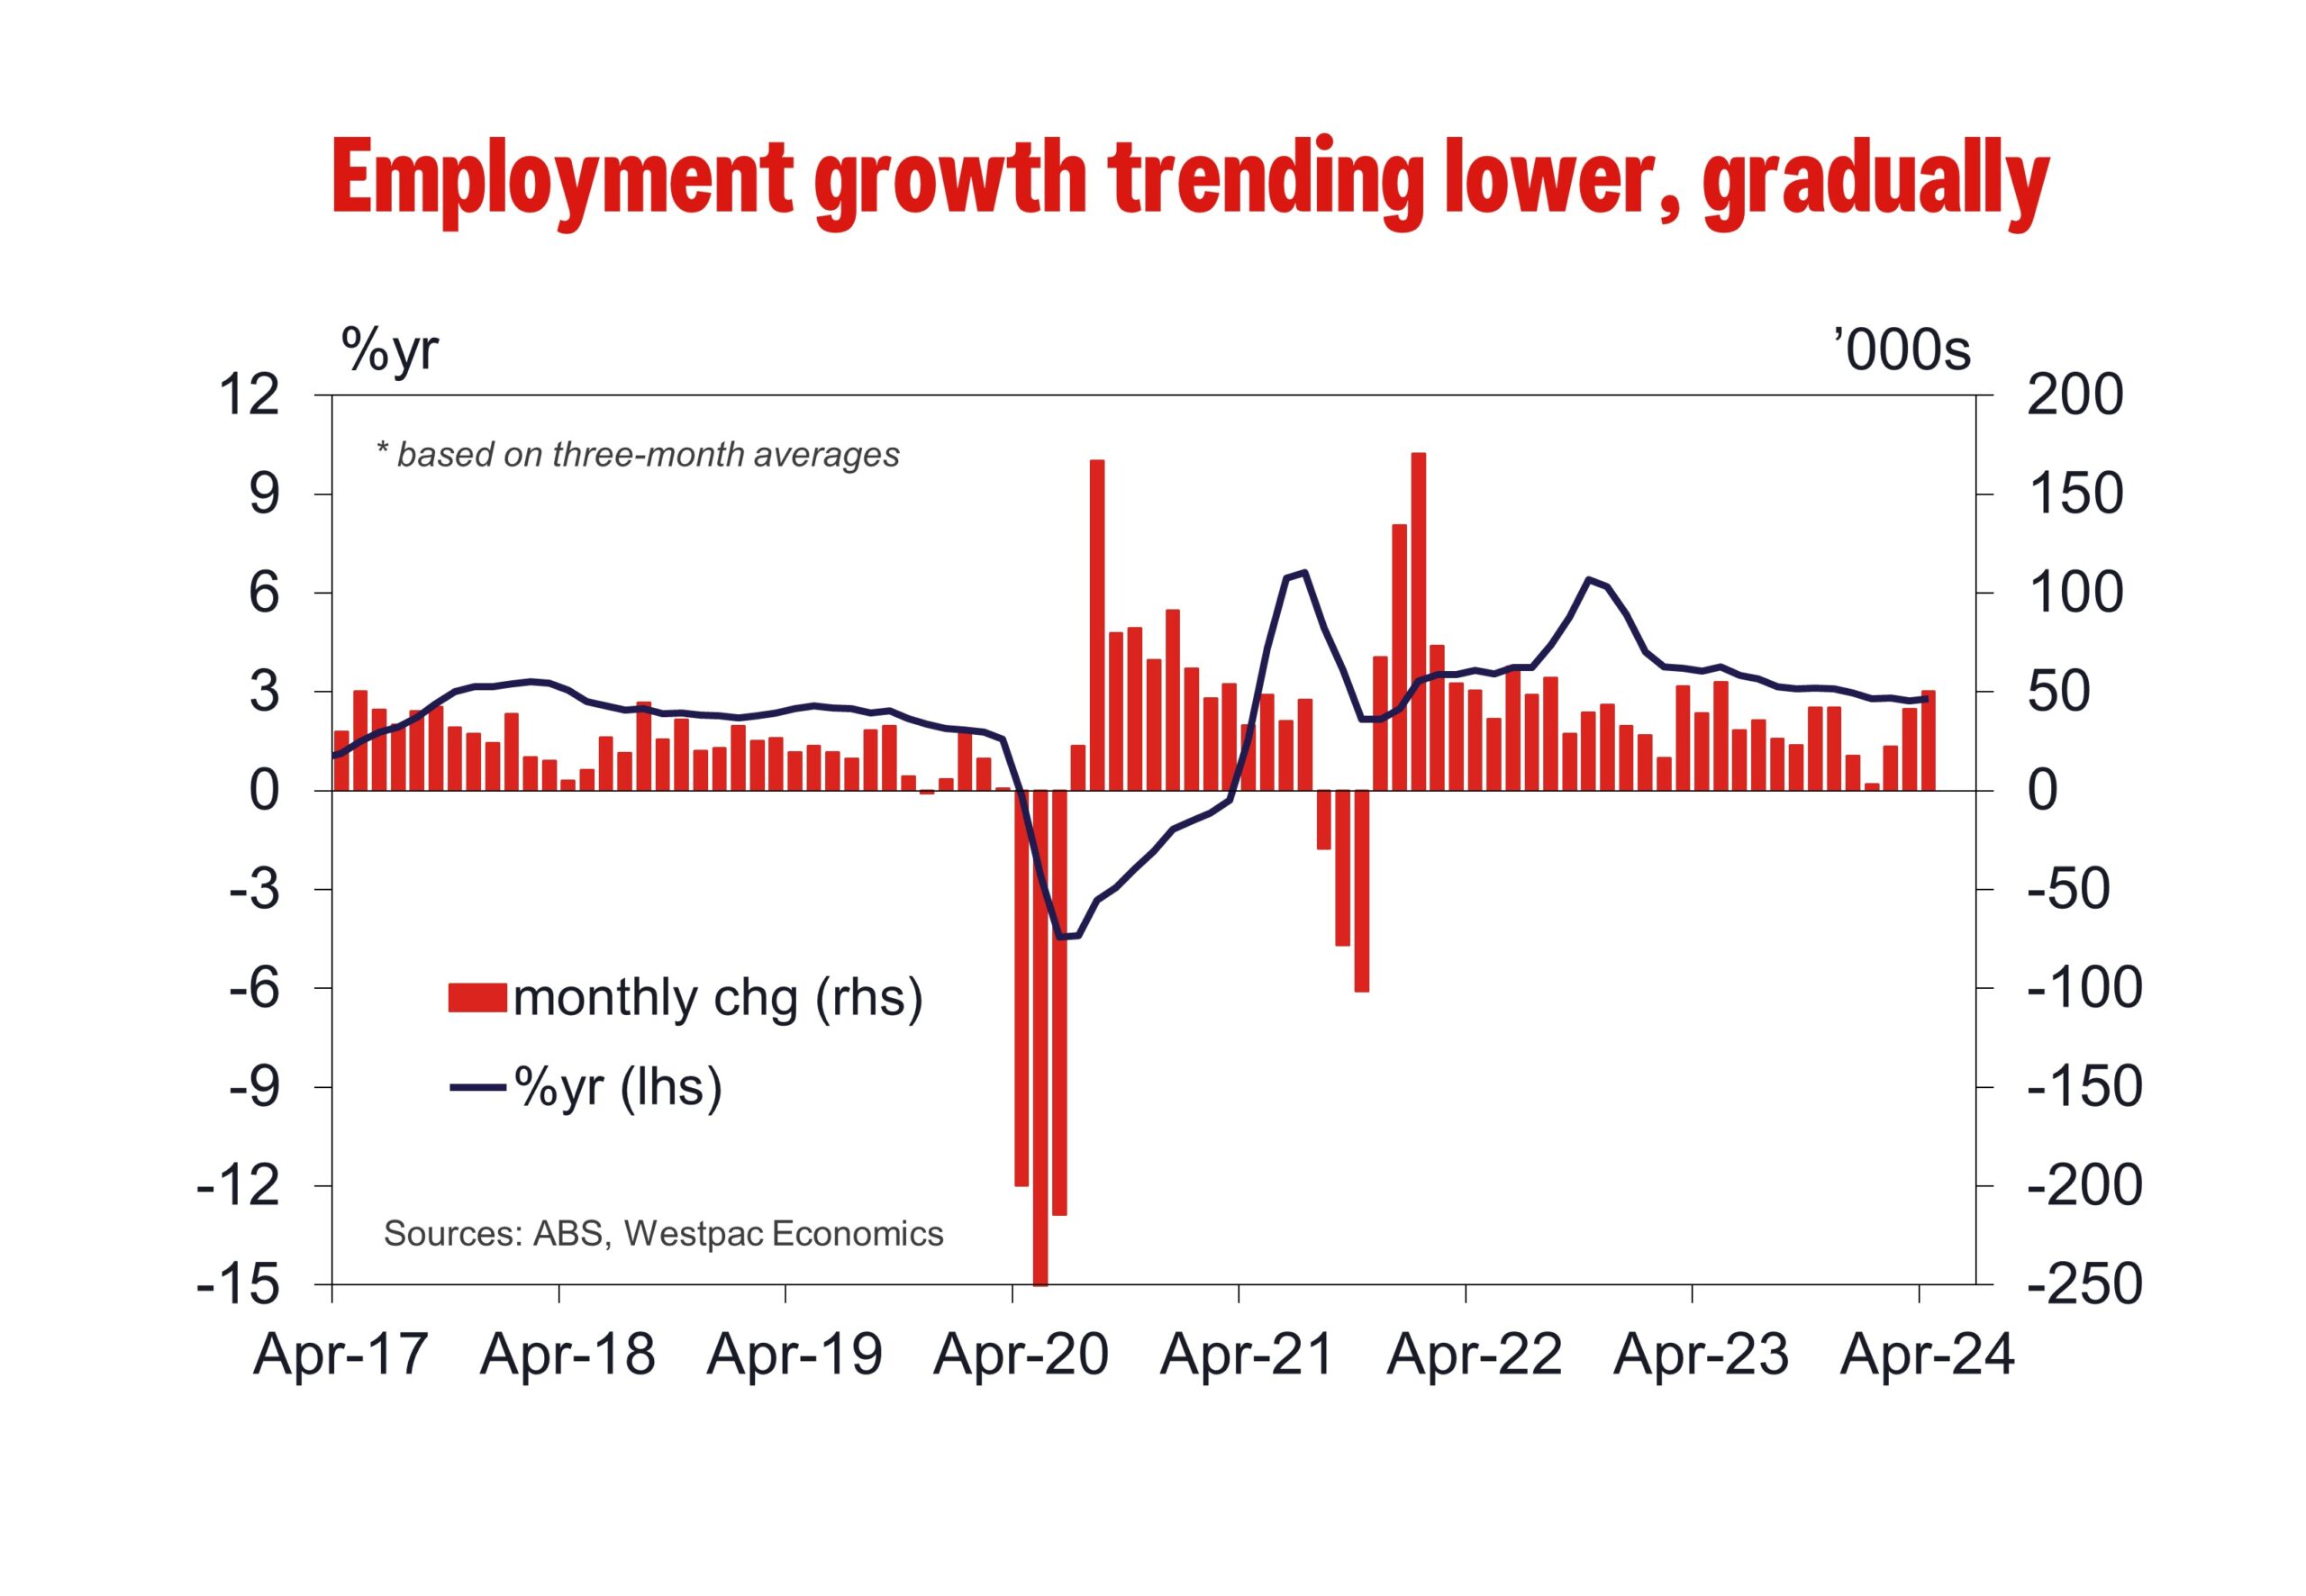
In April, the level of employment rose by +38.5k (0.3%), stronger than Westpac’s forecast for +20k and the market consensus for +23.7k. That follows a fairly volatile opening quarter, with gains ranging from +11.6k in January, to +118.2k in February and –5.9k in March. On a three-month average basis, annual employment growth has held broadly steady at 2.8%yr over the past four months. Still, employment’s current pace remains stronger than 2.0%yr to 2.5%yr ‘norm’ observed in the years prior to the pandemic.
Labour demand has certainly cooled over the past year, but it has only translated into a gradual softening in employment growth. Easing labour demand appeared more clearly in average hours worked over the second half of last year. Since then, it has shown few signs of extended weakness.
In the month, growth in the working age population kept pace with that of employment, seeing the employment-to-population ratio hold steady at 64.0%. While we anticipate growth across both the working age population and employment to moderate over the remainder of the year, the former will likely continue to outstrip the latter, which will see the employment-to-population ratio gradually fall over 2024 after having moved broadly sideways near historic highs over much of 2023.
It is also worth highlighting that the ABS have provided more information around the recent behaviour of seasonally adjusted estimates in the Labour Force Survey. The main takeaway is that recent volatility is likely to be temporary, reflecting changes in the dynamics and behaviours of people and businesses within the context of a historically tight labour market. Elements of that was seen in today’s results with respect to unemployment (below) and was certainly present in many estimates around the beginning of the year. With more data over time, the nature of the changes in underlying dynamics will be better understood.
Unemployment Rate
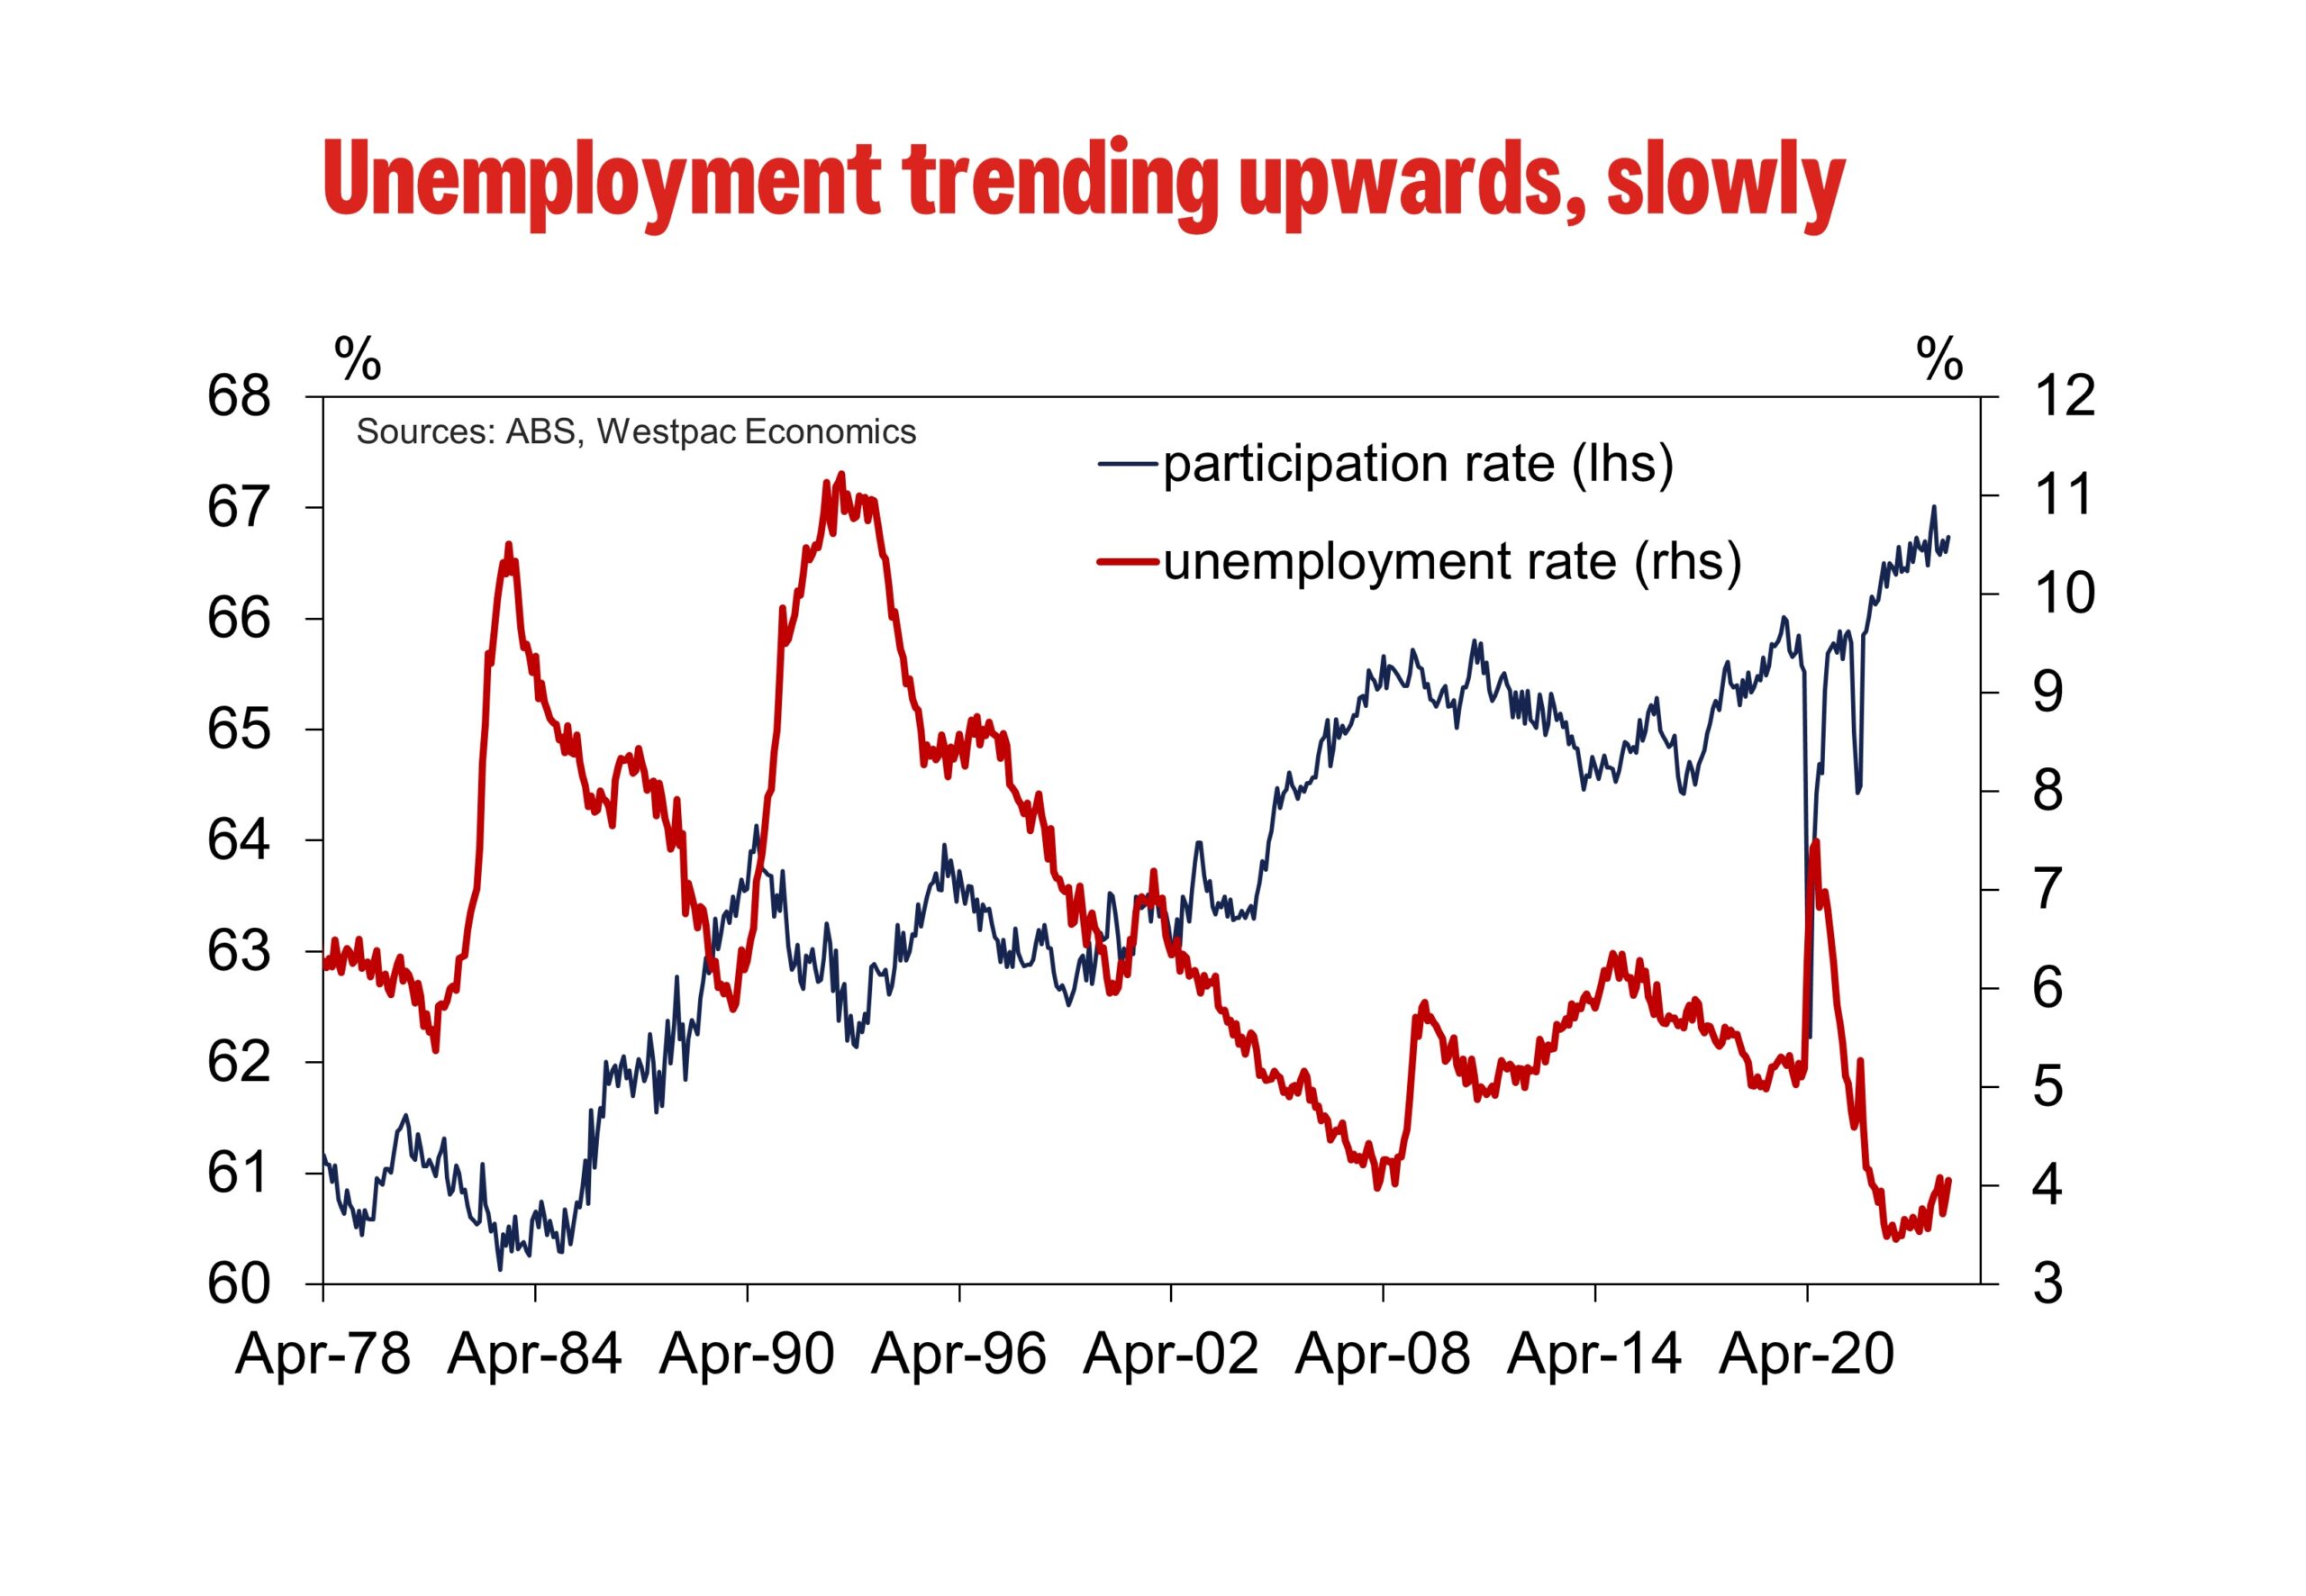
Labour force participation was a little stronger than expected, with the participation rate moving higher from 66.6% in March to 66.7% in April. That implies an appreciable lift in the size of the labour force, up +68.8k. Given the +38.5k lift in employment, that means there was a rise in the number of unemployed persons (+30.3k), which saw the unemployment rate move from 3.9% to 4.1% (4.05% to two decimal places).
The ABS noted that the increase in the number of employed persons partly reflected more people than usual indicating they had a job that they were waiting to start. This is a dynamic that has appeared more prominently in ‘holiday’ months since the reopening and has had an influence in driving month-to-month swings in the unemployment rate. Should these individuals move into employment next month, there is room for the unemployment rate to round back down in May.
Given the upward revision to March (from 3.8% to 3.9%), the impact of the above seasonal dynamics, and the strong round-up in April (4.05% reported at 4.1%), the overall change in unemployment in the month does not represent a material surprise to expectations for the month alone.
Hours Worked
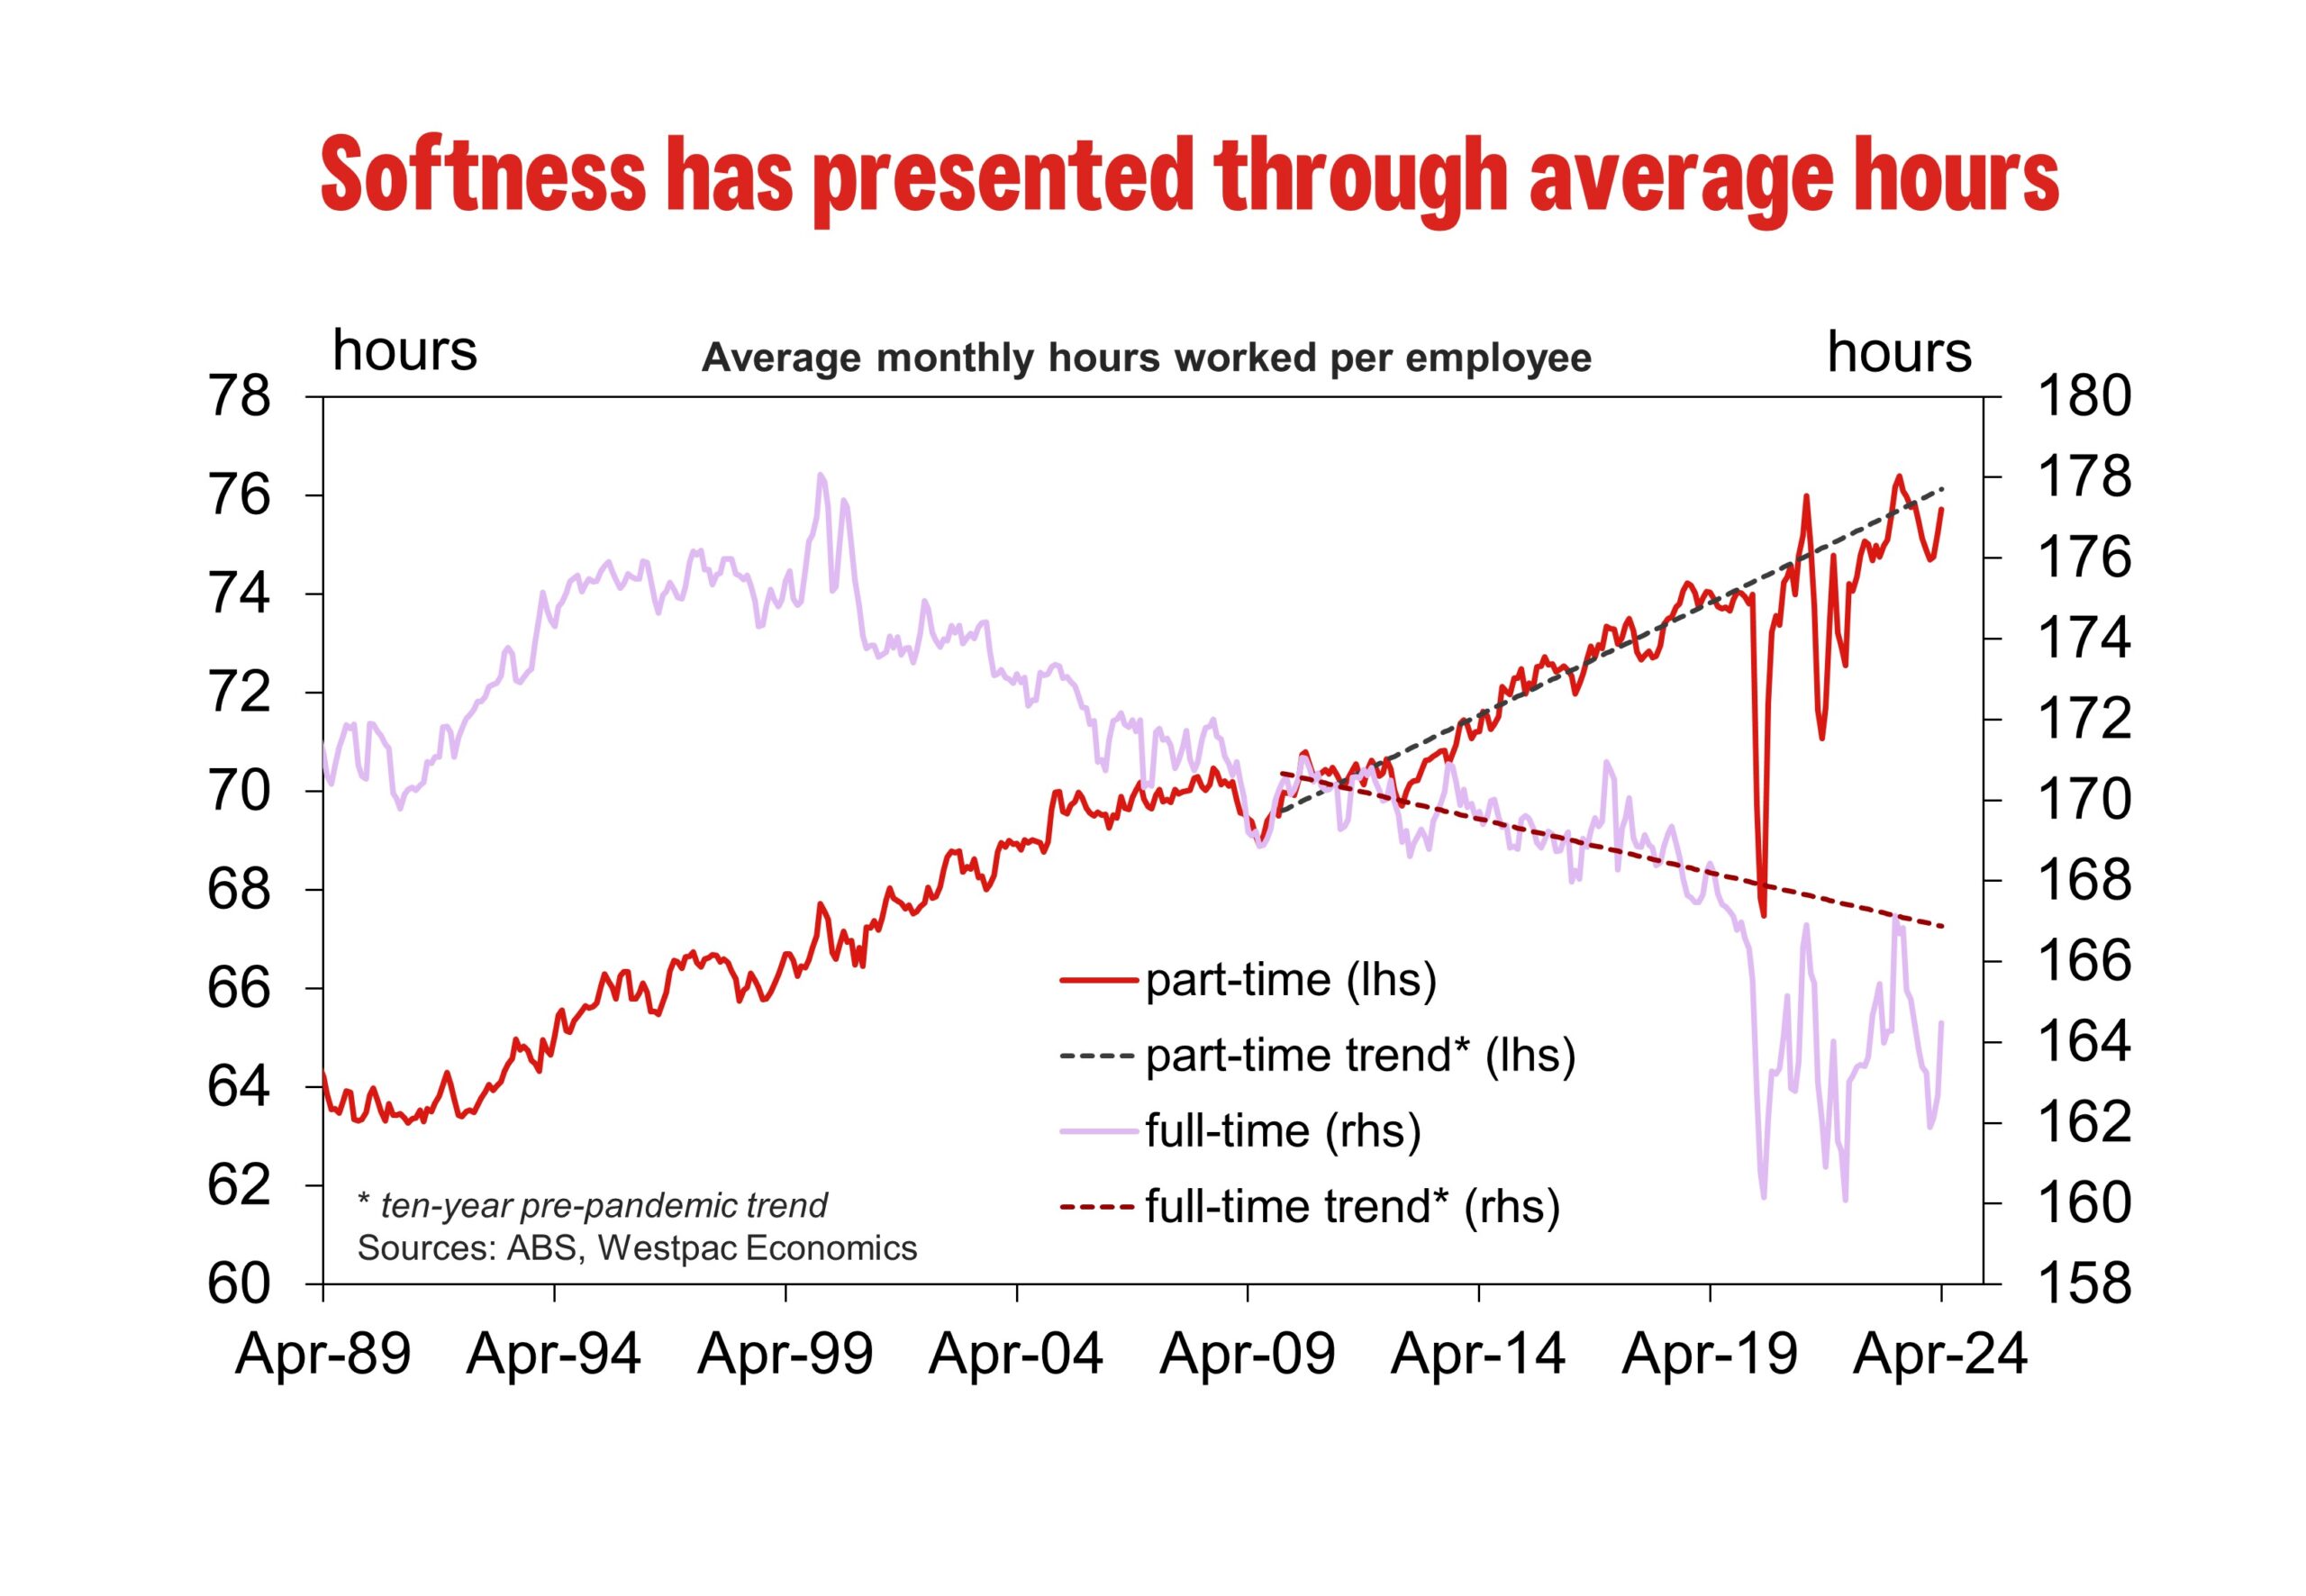
The total number of hours worked has been soft over the last year, notwithstanding the increase in the number of people employed. This continued in April, with the number of hours worked remaining unchanged compared with March. In annual terms, hours worked declined by 0.1%. This was the first annual decline since the pandemic (February 2021).
Hours worked can be volatile from month to month, particularly now given the shift in seasonality. ABS trend data tries to remove this volatility and provide an estimate of the underlying trend. This shows that hours worked declined from June 2023 and started to turn in November 2023. It has now surpassed the June 2023 level. Over this same period employment has increased by around 1.8%.
Robust employment growth coupled with soft hours worked outcomes implies that the average number of hours worked has declined. This is indeed what we have observed but again, this started to turn since November 2023. Average number of hours worked have returned to pre-pandemic levels (January 2020). These dynamics suggests that the labour market went through a significant adjustment in the second half of 2023 and has now started to normalise.
The change in the number of hours worked over April differed across the states. Strong increases were recorded in Tasmania (+5.8%) and Queensland (+1.6), with declines were recorded in Western Australia (-1.8%), South Australia (-0.8%), Victoria (-0.3%) and NSW (-0.2%).
Potential Labour Supply
The bounce back in international students and immigrants returning to Australia when borders reopened was larger than anyone expected. As a result, the working age population grew at a record pace for most of last year. This now looks to have peaked, in the month of September 2023 when looking at the annual growth rate. Despite this, the change in the working age population continues to outpace employment. We expect this will continue to occur going forward. This is consistent with a loosening in labour market conditions – with the unemployment rate drifting higher and the employment to population ratio moving lower.
Other Labour Market Measures
Consistent with the soft hours worked outcome some other labour market indicators also softened over the month of April.
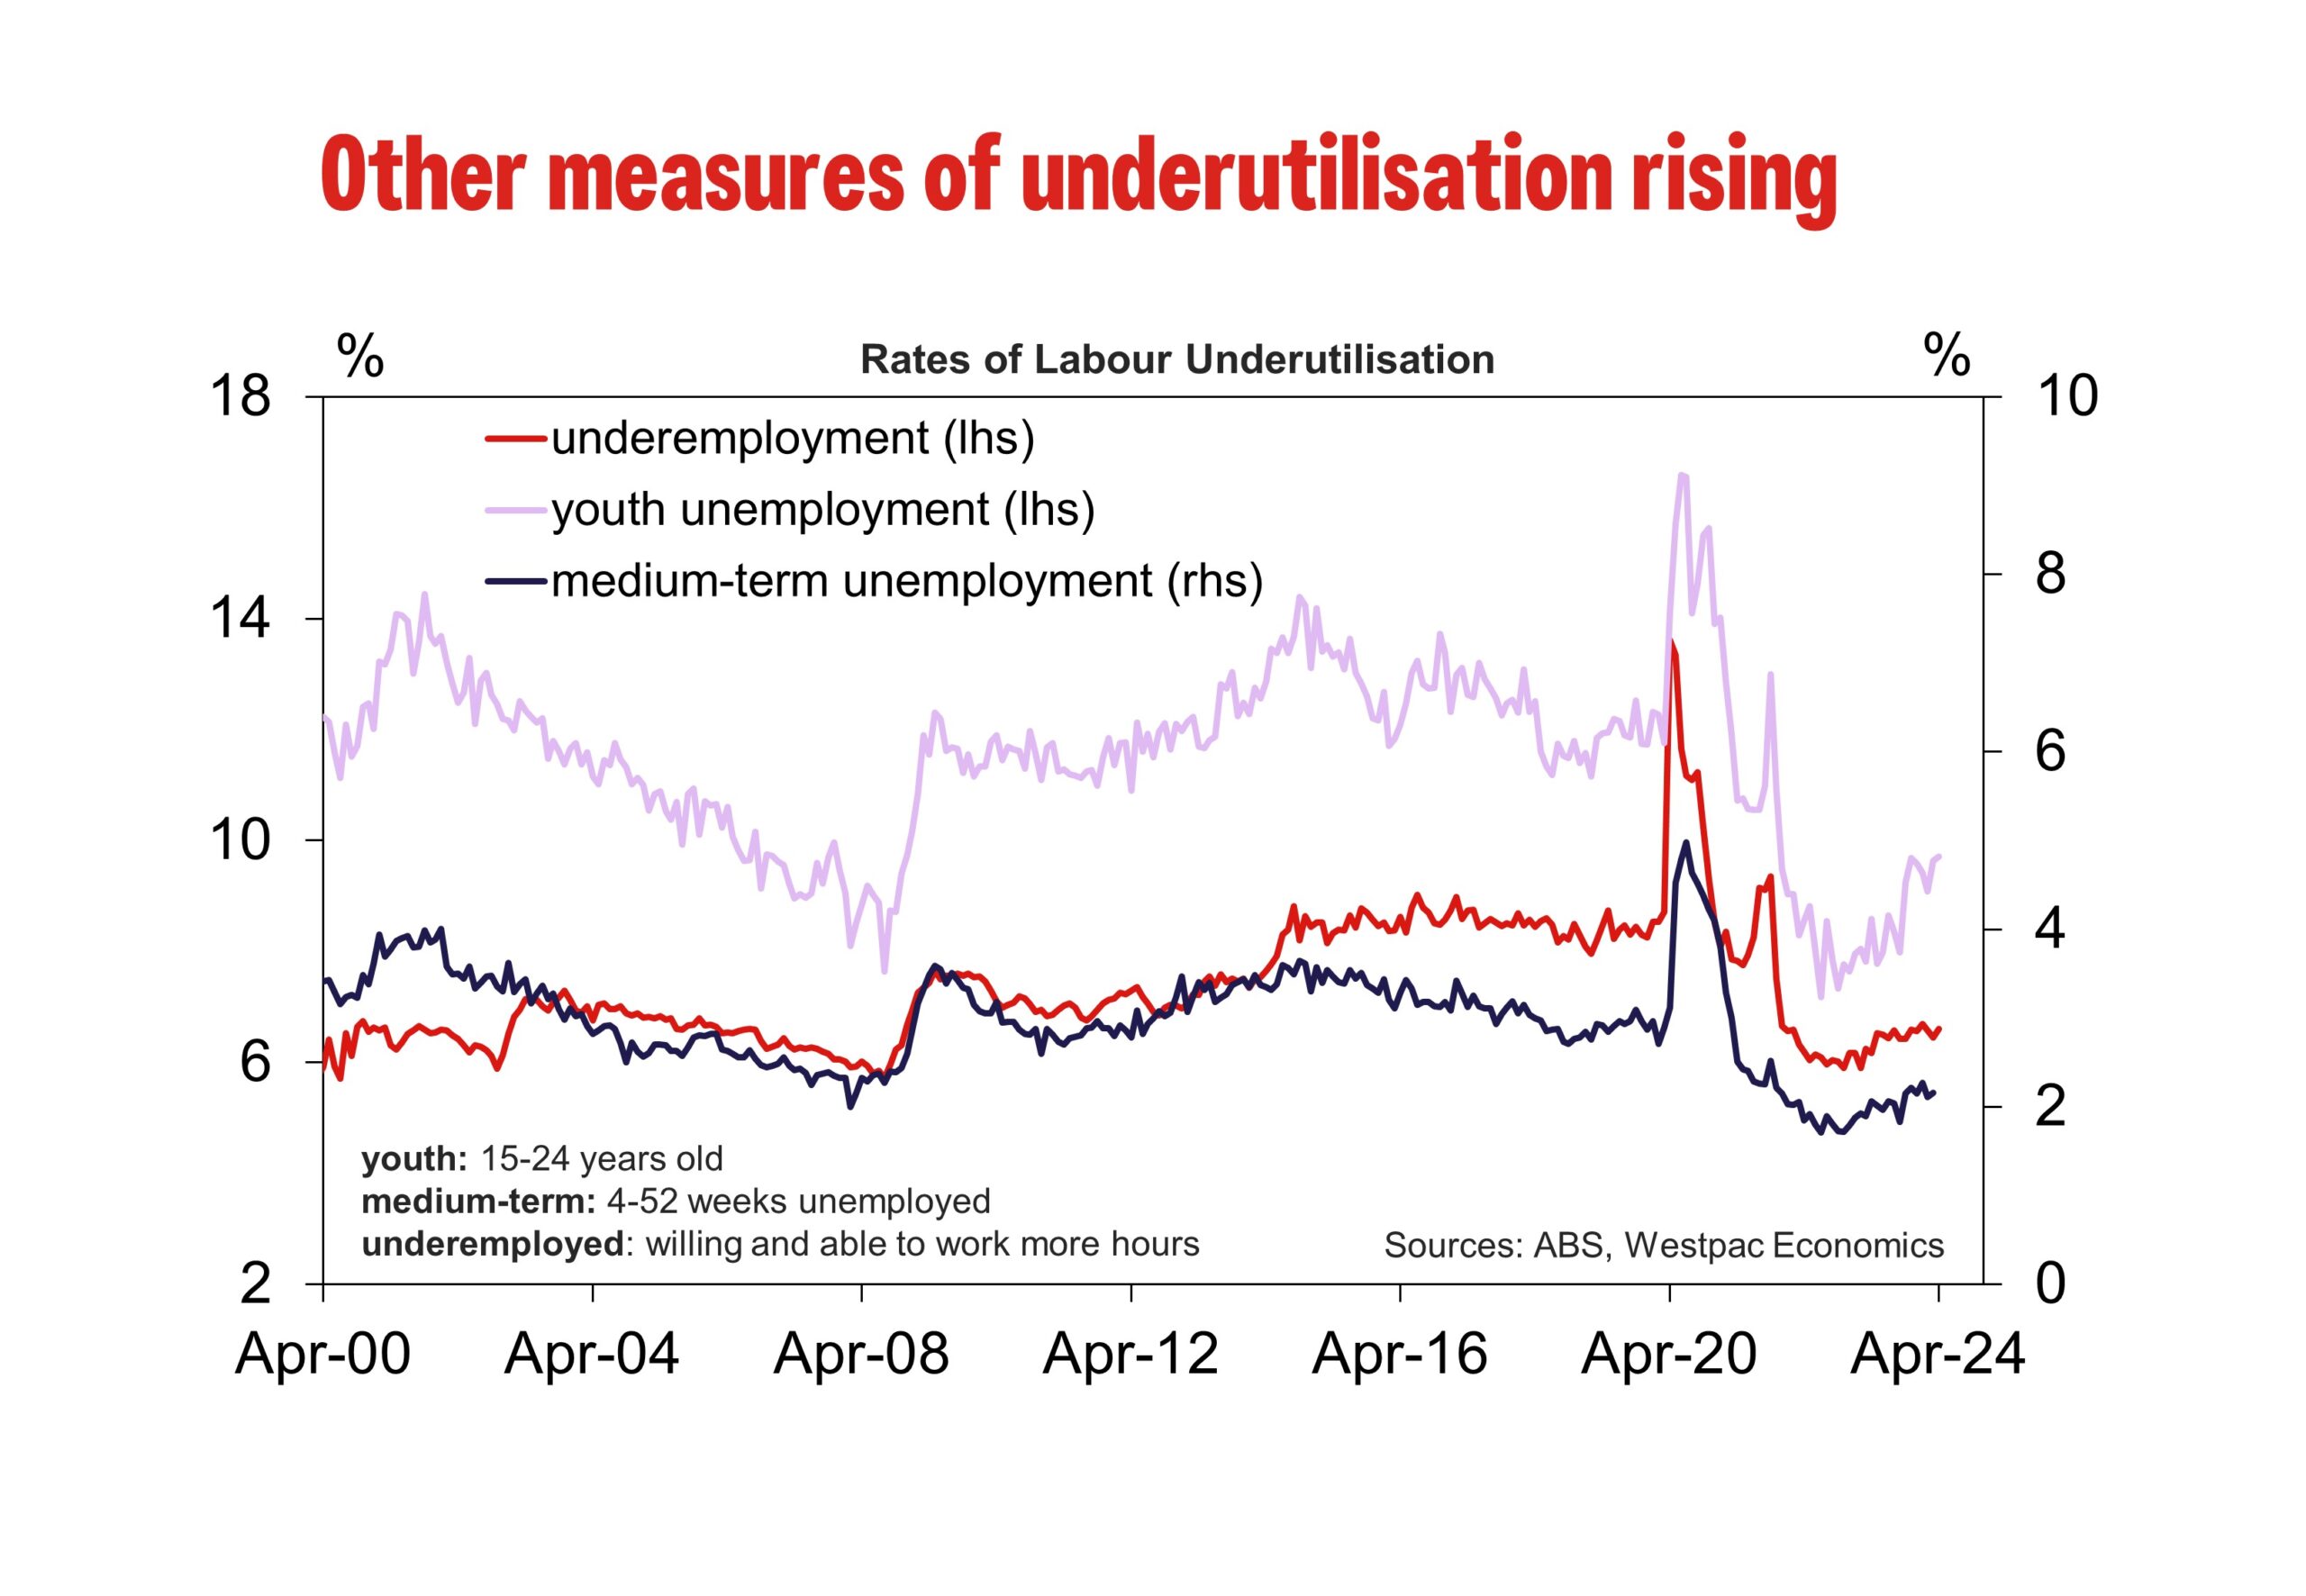
The underemployment rate, which measures the share of employed workers who are willing and able to work more hours, ticked up to 6.6% in April. Over 2023 the underemployment rate has drifted higher in trends terms, coinciding with the slowdown in economic activity.
The underutilisation rate, which combines the unemployment and underemployment rates, jumped to 10.7% – the highest rate since January. Consistent with the underemployment rate, the underutilisation rate has drifted higher in trends terms, from 9.5% in late 2022 to 10.3% in March 2024 (trend terms).
Outlook
The tone of today’s survey, in relation to its implications on the outlook, is not materially different from last month. The dynamics which drove a clear softening in conditions over the second half of last year – namely the ‘correction’ in average hours from elevated levels and a slowdown in employment growth – have not been as strong recently. Looking past the considerable month-to-month volatility, the labour market has generally held in robust health with signs of emerging slack being gradual at best.
As we have emphasised before, the extent to which labour demand will continue to cool over the near-term will critically depend on the interplay between headcount and hours. We continue to anticipate that conditions will gradually soften over the course of this year, as employment growth continues to soften and the unemployment rate ticks up to a quarter-average of 4.3% by year-end.