U.S. Highlights
- Investors this week were kept busy with the release of the GOP tax reform plan, which sent small cap stocks higher and the S&P 500 lower immediately after its announcement. President Trump nominated current Federal Reserve Board Governor Jerome Powell to succeed Janet Yellen as Chair of the Fed in February 2018.
- Volatility as a result of Hurricanes Harvey and Irma skewed data released this week, but the outlook for the fourth quarter remains positive, with hiring in October recovering from hurricane setbacks. Inflation continues to disappoint, with core PCE holding steady in September at 1.3% y/y, and wage growth disappointing in October, rising only 2.4% y/y.
- We expect inflation to reach its 2.0% target late in 2018, with robust economic activity in the meantime giving the Fed enough ammunition to proceed with a rate hike this December.
Canadian Highlights
- The Canadian economy continues to generate jobs at a robust clip, adding 35.3k jobs in October, marking the 11th straight month of positive job growth. Gains were entirely within full time work, helping to push overall hours worked up 2.7% year-on-year.
- In other data, monthly GDP by industry showed a 0.1% pullback in Canadian economic activity in August and international trade showed a decline in both export and import volumes in September. All told, the data suggest a slowdown in real GDP growth in the third quarter to sub-2%, roughly in line with the Bank of Canada’s recent forecast.
U.S. – Investors React to GOP Tax Reform Plan
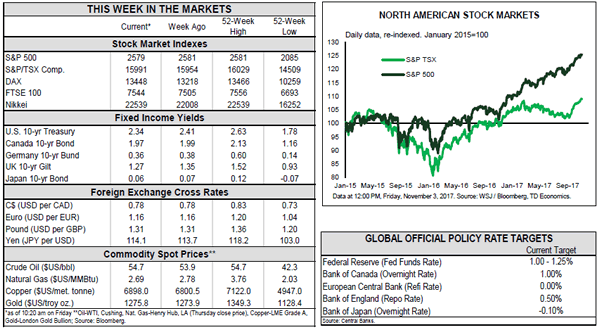
Thursday’s release of the Republican tax overhaul plan finally gave investors more detail to chew on in determining the winners and losers of the most significant reworking of the tax code in over three decades. The plan slashes the top corporate tax rate from 35 to 20%, and the announcement boosted small cap stocks on account of their higher effective corporate tax rate, while the S&P 500 stumbled in the aftermath of the announcement. The proposal to cut the mortgage interest deductibility in half to $500,000 drove a sell-off in homebuilding stocks. This effective tax increase could dent housing demand particularly in high-priced markets, such as Washington, D.C. and Boston where the median home price already exceeds $500,000. Next, the bill will head to the House Ways and Means Committee before going to the House and Senate for approval. Should the plan progress smoothly, investors should look for small caps to appreciate further while large cap stocks will likely struggle as a result of the scaling back of interest payment deductibles. The USD depreciated as investors weighed the tax plan, but recovered by Friday, while bond yields fell.
Other events on Capitol Hill this week included President Trump’s nomination of current Federal Reserve Governor Jerome Powell to succeed Janet Yellen as Chair of the Federal Reserve on February 3rd, 2018. Given Powell’s views that align with the FOMC consensus, markets remained calm following the announcement. Moreover, in addition to tax reform prospects, investor sentiment was supported by indications that economic growth is likely to remain strong this quarter.
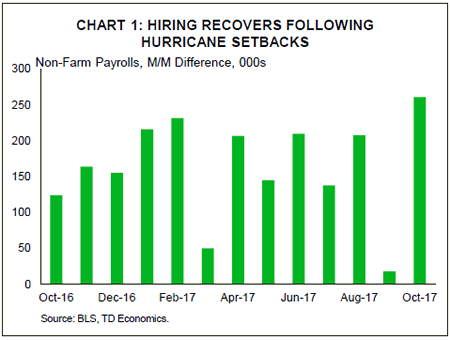
Volatility as a result of Hurricanes Harvey and Irma skewed data released this week, but the outlook for the fourth quarter remains positive and is helped by a solid finish to the third quarter. Strength in consumer spending in September, notably on durable goods, sets the stage for another strong showing from households in the fourth quarter. This was echoed in October’s vehicle sales which remained elevated as consumers replaced flooded cars, something that is expected to gradually fade in the months ahead. A tighter labor market should act to support household spending further. Indeed, this morning’s October payrolls report showed that hiring bounced back from the previous month’s hurricane-related disruptions (Chart 1). Additionally, the ISM manufacturing index components including new orders, production, and employment have held near cycle highs since mid-year and indicate that the sector is on solid footing, supported by strong domestic and foreign demand.
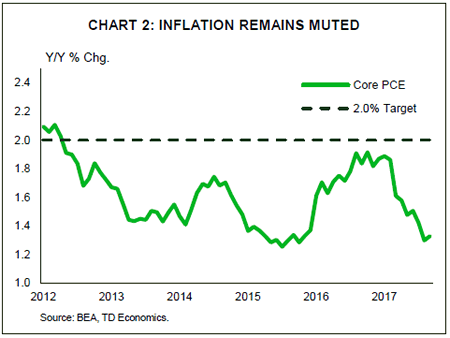
While real activity remains rosy, inflation continues to disappoint. Core PCE held steady in September at 1.3% y/y (Chart 2), while wage growth disappointed in October, rising only 2.4% y/y. Weak inflation continues to confound the FOMC, leading the committee to leave its policy rate unchanged this week. However, as the unemployment rate continues to push further below its natural rate, inflation is likely to gain traction in the year ahead and is expected to reach its 2.0% target late in 2018. We expect that these pressures should give the Fed enough ammunition to proceed with a rate hike this December.
Canada – Steady Progress Toward Full Employment
One of the most important factors to the outlook for monetary policy is the central bank’s assessment of how close the economy is to its potential. For the Bank of Canada this is typically done with a focus on real GDP, taking into account the utilization of both labour and capital. However, in the most recent October MPR, the central bank made a point of noting that even as the overall economy appeared to close to capacity, the labour market still appeared to have some slack remaining. This is in spite of the fact that the unemployment rate (which edged up to 6.3% in October) appeared close to levels associated with full employment.
The evidence of shadow labour market slack that the Bank of Canada pointed to in the MPR was threefold: elevated long-term unemployment, low average hours worked, and modest wage growth. Given the Bank’s data-dependent focus and its specific mention of these metrics, it is worth unpacking their evolution. With the release of the October Labour Force Survey, we have one additional data point to add to the analysis.
For the most part, the data show a steady reduction in slack over the last year, consistent with above-trend economic growth. In terms of long-term unemployment, Statistics Canada’s supplementary data show a rate of 2.2% for people unemployed for more than three months. This is the lowest level since prior to the recession. In fact, it is right in line with the average from the early 2000s. While the rate was lower in the period from 2006 to 2008, according to the Bank of Canada’s output gap measure, the Canadian economy was operating above potential at this time.
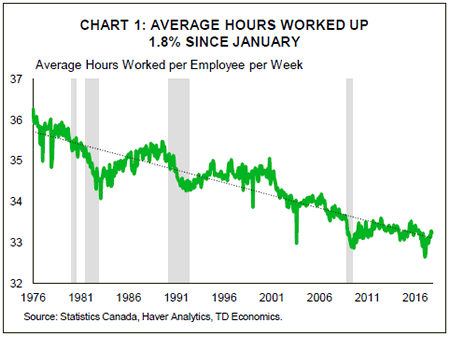
Average hours worked has also shown meaningful improvement in recent months. On a year-over-year basis, average hours worked were up 1% in October. Even more impressive, average hours are up 1.8% relative to the trough in January of this year. To put these gains in broader context, there is a clear downward trend to the series (Chart 1). Major steps down appear to occur around recessions, and then remain relatively steady. This suggests that even as average hours continue to move higher, they may not go back to previously-observed levels.
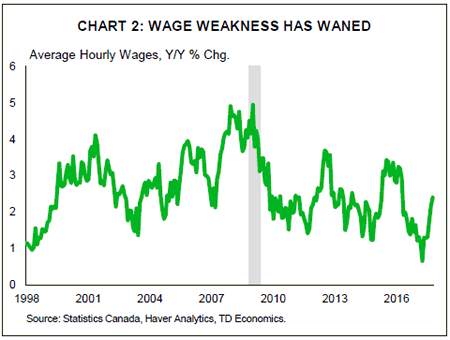
Finally, in terms of wage growth, the trend on a year-on-year basis has reversed swiftly over the past several months. From a trough of just 0.5%, year-on-year wage growth accelerated to 2.4% in October. This is just 0.2 percentage points below its average since the early 2000s (Chart 2). Incidentally, wage growth has been the fastest in periods of relative economic weakness. It peaked at close to 5% during the 2008 recession, and was running above 3% during the most recent period of commodity-related weakness in 2014/2015. If anything, the indicator appears to be a lagging one. Its recent acceleration is confirmation of strong economic growth and a good sign that inflation is likely to turn higher in the months ahead.
All of this suggests that as with the overall output gap, the labor market is increasingly giving an all clear ahead signal to the Bank of Canada to continue tightening monetary policy.
Canada: Upcoming Key Economic Releases
Canadian Housing Starts – October
Release Date: November 8, 2017
Previous Result: 217.3k
TD Forecast: 215k
Consensus: N/A
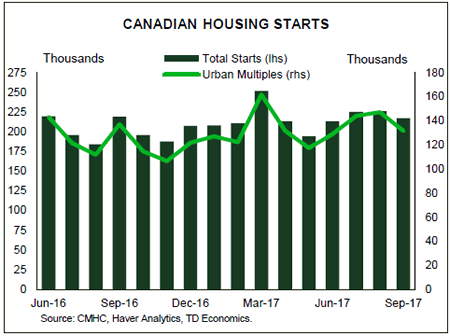
Housing starts are forecast to post a modest decline in October to an annualized 215k from 217k the prior month. Both single and multi-unit starts are running above their six-month trend and residential construction still has not reacted to the slowdown in the broader resale market, though we have seen signs of stabilization in the last couple months. Furthermore, warm weather in September has given way to more seasonal temperatures, which will act as a headwind to construction at the margin.
