Week beginning 6 November 2017
- RBA on hold; prospects for property investors are not encouraging.
- Australia: RBA policy decision, ABS CPI re-weighting, housing finance.
- NZ: RBNZ policy decision, inflation expectations survey, retail card spending.
- China: CPI, PPI, new loans.
- Euro Area: Sentix investor confidence.
- US: Uni. of Michigan consumer sentiment.
- Central banks: BNM and BSP policy decisions.
- Key economic & financial forecasts.
Information contained in this report was current as at 3 November 2017.
RBA on Hold; Prospects for Property Investors are Not Encouraging
The Reserve Bank Board meets next week on November 7. The Board is certain to keep rates on hold.
In previous years November has been a very popular month for changing rates but not this year.
Rates have not been adjusted in November since 2011. However in the six years from 2006 to 2011 there was a rate move at every November Board meeting.
In recent times, November has also been a popular "target" for market expectations of rate moves. Following the rate cut in August last year, markets were confident that there would be a follow up cut in November – Westpac was not convinced with that view and the November meeting passed with no change.
Some months ago, offshore investors assured me that the Board would adopt a tightening bias at the November meeting. That prospect has since dissipated.
On Monday, the Australian Bureau of Statistics will release the revised weights for the Consumer Price Index. This is a five year event (now to be revisited every year) and, in the past, has seen the revised weights lead to a reduction in the CPI of around 0.2 percentage points over the year. Another downward effect is almost certain as spending patterns evolve towards those components that have fallen in terms of relative prices. Westpac expects the revised weights to reduce the outlook for inflation over 2018 by 0.4 percentage points for headline inflation and 0.3 percentage points for underlying inflation. Note that historical inflation estimates will not be affected.
The Board will have the opportunity to review the Bank’s own assessment of the revised weights on the inflation outlook at the meeting on Tuesday.
It is also likely to take a closer look at developments in residential property markets – particularly Sydney.
Note that the Governor’s Statement following the October Board meeting included, "In Sydney, where prices have increased significantly, there have been further signs that conditions are easing".
Recent data shows that six month annualised inflation in the Sydney market has fallen from 22% at January this year to -0.7% in October. Of particular interest for the Sydney market is going to be the behaviour of investors going forward.
Conditions for investors appear to be deteriorating.
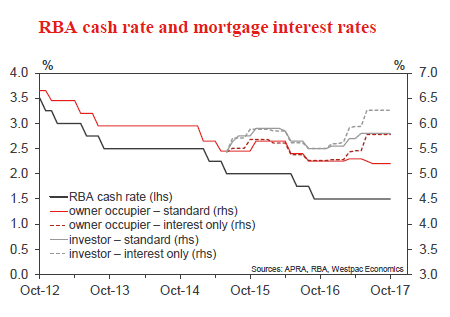
For a start, banks have raised interest rates for investors through 2017. Headline rates for interest only investor loans have been increased by around 75 basis points; while headline rates for principal and interest investor loans have been increased by around 30 basis points. These increases follow the moves in 2015 of 45 and 38 basis points respectively. Lending guidelines have also been tightened with expenses being more closely scrutinised and nonwage incomes more heavily discounted.
The most recent changes have been in response to APRA’s direction to the banks to slow the growth in interest only loans to 30% of flows.
Land taxes and municipal rates are also challenging investors as these imposts increase in response to the recent boom in land values in Sydney. Some investors report that land taxes, in an environment of low rental growth (the rent component of the Consumer Price Index rose by less than 1% over the last year) are claiming up to 40% of rental income. Average gross rental yields in Sydney are around 3.5%.
State government stamp duties for foreign investors have been boosted by around 7-8% (although other countries have been more aggressive – Toronto; Vancouver; Hong Kong and Singapore have established "aspirational" levels of 15%).
Some investors may also be unnerved by other aspects of government policy.
The 2017 Commonwealth Budget excluded depreciation allowances on used apartments while "inspection travel" deductions were banned.
Investors are also concerned the NSW state government might aim to strengthen the rights of tenants with limits on rent increases; making evictions more difficult; and imposing longer rental periods. Superimposed on all these concerns are the stated policies of the Federal Opposition.
In the July 2016 election the ALP indicated that, if elected, from July 1 2017 negative gearing would only be available for new investments. The capital gains tax discount of 50% would be reduced to 25% from July 1 2017.
Neither change was ear marked to be retrospective and would therefore only have applied to investments made after July 1 2017. With another Federal election due in 2019 and the ALP holding a sustained and commanding lead in the opinion polls, investors will be making decisions on the basis of this potential change in tax policy.
We cannot discount the possibility of investment activity being brought forward to take advantage of the "grand fathering" of the ALP’s policies, although the other headwinds which have been discussed above are likely to contain any "bring forward" effect.
Dominating the investors’ decisions’ will be prospects for capital gains. With price momentum easing, those prospects will be decidedly unattractive to investors.
It appears that the prominent role of investors in the Sydney market is already dissipating and that is likely to continue. That process can only continue to ease pressure in the Sydney market, with the most likely outcome being a long period of flat prices.
What does this mean for interest rates?
The Reserve Bank has indicated that interest rates will be targeted at inflation and growth while macro prudential policy will address financial stability.
Current trends indicate that financial stability concerns will be easing for the Bank.
That suggests that a further "round" of macro prudential policies will not be necessary.
Interest rate increases that might accelerate weakness in real estate markets which might have a spill over impact on confidence and spending will also be unattractive.
However, interest rate cuts to head off a more severe adjustment in housing markets still seem quite remote.
The Week that Was
This week in Australia, the focus shifted to housing and the consumer. Meanwhile offshore, the US’ FOMC and UK’s Bank of England met; President Trump provided more detail on planned tax reform; and we also received an update on PMIs across Asia.
Starting with the Australian housing market, the release of the October CoreLogic home value index received considerable attention, with the significance of the macroprudential reforms introduced in March clearly on display. The key points include: that Sydney prices have fallen about 0.6% over the past three months, resulting in the annual pace of growth halving from 15.4% in July to 7.7%yr in October; meanwhile, Melbourne prices have held up, annual growth having only slowed from 13.1%yr at July to 11.0%yr in October. Of the remaining states, Perth continues to see price declines (-2.5%yr) while prices rose 4.6%yr in Adelaide and 2.7%yr in Brisbane. We expect the slowdown to carry on to year end as March’s regulatory change has an enduring effect.
On housing construction, dwelling approvals surprised to the upside in September, gaining 1.5% against an expectation for a 1.0% fall. In September, NSW was the best performer (10.7%; 3.7%yr) as high-rise approvals surged; but this follows six months where NSW experienced the most abrupt downturn, due to weakness in the high-rise component. Vic and Qld in contrast reported monthly declines, respectively -2% (3.2%yr) and -17% (-14.9%yr). Monthly volatility aside, we anticipate approvals in all of the eastern states will continue to trend down. Residential investment will therefore subtract from growth through 2018 as projects are completed and the pipeline is not replenished.
On to household consumption, both the value and volume of retail sales in the September quarter was a material disappointment. See chart of the week for further detail.
Also released this week for Australia, the trade balance for the month of September surprised to the upside as export growth jumped 2.9%. An 8% gain for metal ores, the result of stronger volumes, and a rebound in gold were key positives as were further gains for services, now up 12.4%yr. Importantly, this outcome means that net exports will add to growth in the September quarter, likely circa the 0.3ppts we had anticipated.
Turning to the global economy, October PMI data was released for China and the rest of Asia. While China’s official NBS PMI’s came in below market expectations, they still suggest momentum in the manufacturing and services sectors remained robust. This is despite more stringent environmental controls being introduced by authorities. Activity was constructive; however, employment remains a downside risk for the outlook, being subpar relative to its history. We continue to anticipate that growth will slow materially in 2018, from 6.8% to 6.2%. Public and private investment continues to slow, and softer employment growth is likely to restrict consumer-led growth. Thinking further forward, following last week’s 19th National Peoples’ Congress, it is clear that significant changes are underway in China, both with respect to how its economy operates, and how it engages with the world.
For the rest of Asia, the PMIs were mixed in October. Japan maintained an above-average pace, as India and Indonesia retraced back to near the 50 expansion/contraction level. Broadly, external demand remains supportive for the region. While many nations face challenges on the domestic front, their ongoing economic development holds great promise.
In the US, the FOMC has been front and centre. The November FOMC meeting met expectations with a December hike already priced in by the market. Since September, the Committee’s confidence in the growth outlook has received additional support from the above-expectations GDP print for Q3 as well as the continuing nascent uptrend in wages growth. Still, the FOMC remain concerned over the inflation outlook. The slack underlying the soft inflation trend will likely limit rate hikes to a further two in 2018 following December’s anticipated 25bp hike. Powell’s rise to Chair of the FOMC is unlikely to materially change the outlook for rates; still, it will be important to assess his and the Committee’s views on the risks to the outlook in coming months.
Just to hand, further detail on proposed tax reform was offered by President Trump and the House Republicans. Broadly, the House tax plan accords to the initial guidance offered by the Trump administration. However, a number of revenue raising initiatives have had to be added to bring the cost of the package over the coming decade down to the $1.5trn that the Senate is willing to agree to. We will parse the detail of the proposal in coming days and provide further guidance on the path ahead.
Finally in the UK, they may face a very different situation to the US, but the Bank of England has been as resolute in the need to raise rates. Above-target inflation and unemployment at four decade lows were used to justify a 25bp hike despite sluggish activity and formidable uncertainty over the outlook. However, as we expected, this was a dovish hike, with the Bank’s forecasts indicating they only expect two hikes by end 2020. Given the risks, this is likely to be an upper limit for rate actions.
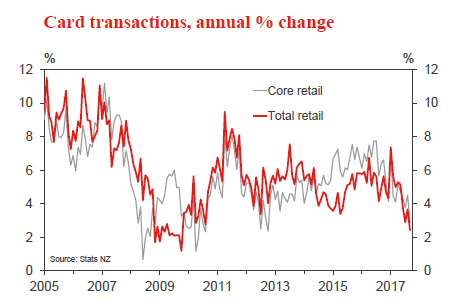
Chart of the Week: Q3 real retail trade
Real retail sales, i.e. volumes, were estimated to have risen slightly by 0.1%qtr, slightly better than the market expectation of flat. This compares to nominal sales down 0.3%qtr for Q3 as a whole, the weakest result since 2010.
Solid volume gains for food (+0.9%qtr) and clothing (+0.7%qtr) were offset by sizeable falls for household goods (-1.7%qtr) and department stores (-1.4%).
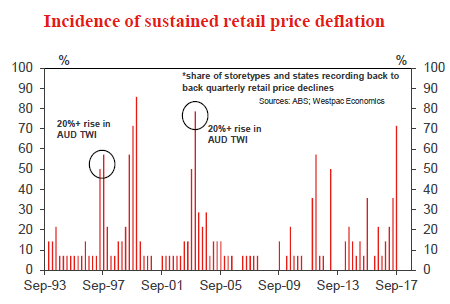
Stepping back, the picture from the report is an unambiguously bad one for retailers – who are cutting prices but finding no traction with volumes.
The picture is not quite as bad for consumers who get some advantage from lower prices and do not look to be cutting back on consumption quite as sharply as feared.
The wash-up still points to marginal downside risks to the wider consumption estimates in the Q3 national accounts.
New Zealand: Week Ahead & Data Wrap
This week’s September labour market report painted a slightly stronger picture than expected. Employment jumped by 2.2%, although we recommend treating that number with caution. It followed a 0.1% fall in the June quarter, which didn’t jibe with other labour market indicators at the time. And the labour force participation rate followed a similar pattern, falling to 70.1% in the June quarter before rebounding to an all-time high of 71.1% in September. We suspect that changes to the Household Labour Force Survey in June 2016 may have disrupted the seasonal pattern of the employment and participation series.
The unemployment rate is probably a more reliable measure of how the jobs market is performing, and it too surprised on the positive side, though only slightly – unemployment fell from 4.8% to 4.6%, beating market forecasts of a fall to 4.7%. This is the lowest rate since December 2008, when the Global Financial Crisis was reaching full force.
Despite the improving trend in unemployment, wage growth remains subdued. The Labour Cost Index (LCI) rose by 1.9% in the year to September. However, about 0.3% of that increase was due to the pay equity settlement for aged and disability care workers. Excluding that impact, annual labour cost inflation actually slowed a little, from 1.7% in the June quarter to 1.6% today.
That leads us to a crucial question: how tight is the labour market? That is, how close is the economy to ‘full’ employment, which is generally taken to mean the lowest rate that can be sustained over the long term (and might soon be a target of the Reserve Bank’s).
The unemployment rate has improved substantially over the last couple of years, but history suggests that it can go further. Unemployment was below 5% for much of the 2000s, and even below 4% for a stretch. Wage growth picked up in that time, but it didn’t really take off until unemployment was below 4%.
Ultimately, the test of whether the labour market is ‘tight’ is whether (real) wage growth is accelerating. Real wage growth has actually been reasonably strong compared to last decade, largely because inflation has been persistently and surprisingly low (in contrast, inflation was persistently and surprisingly high for much of the 2000s). But now that inflation is picking up from its lows, we have yet to see a matching lift in wage growth. And that provides at least circumstantial evidence that the labour market still has some slack left in it.
The other key development of the past week was the ANZ Business Outlook survey. Confidence in the economy fell into negative territory (-10.1) in October, while firms’ confidence in their own activity eased to the lowest level since the 2015 "dairy downturn". While confidence may have been dampened by lingering uncertainty around the election, this fall was not a response to the change in Government – the survey was conducted after the election but before coalition negotiations were complete. Instead, firms appear to be registering the same general slowdown in the economy that we have been observing in recent months.
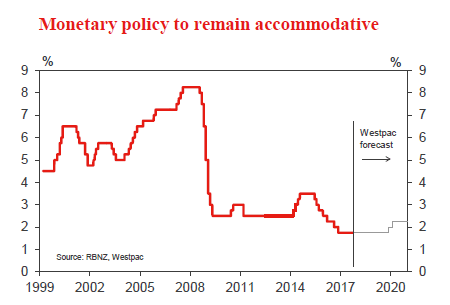
Next week the Reserve Bank will release its first Monetary Policy Statement under Acting Governor Grant Spencer. We expect no change to the OCR forecast, which in August was for the OCR to remain unchanged until 2019 and to rise very gradually thereafter. We also expect the RBNZ to retain exactly the same policy guidance paragraph that it has used more-or-less unchanged since February this year:
"Monetary policy will remain accommodative for a considerable period. Numerous uncertainties remain and policy may need to adjust accordingly."
To be sure, the details of the MPS will be different to past missives. The RBNZ needs to downgrade its GDP and house price forecasts to reflect the reality of recent data. The construction sector seemed to stall for much of this year; GDP growth has been below expectations; businesses’ confidence in their trading outlook has fallen; the house price boom came to a halt; and consumer spending has flat lined since April.
At the time of the September OCR Review we argued that the run of weak data recently could prompt the Reserve Bank to issue a more dovish statement in November. However, there was always an important caveat to that – we said "The remaining determinant of the overall tone in November will be the exchange rate. If it falls by enough to provide some prospective stimulus to inflation, the RBNZ would be able to leave its OCR guidance unchanged."
That is exactly what has happened. The exchange rate has fallen sharply and unexpectedly in recent weeks, mainly due to the election outcome. The Trade Weighted Index is now 6% lower than the RBNZ forecast in the August MPS. This will provide some much-needed stimulus to the RBNZ’s inflation forecast, and will allow the RBNZ to run with the same OCR forecast as previously.
The other reason to expect a "straight bat" from the RBNZ at next week’s Monetary Policy Statement is that the election result has made the economic outlook so much more uncertain. The new Government’s housing policies will have a difficult-to-determine negative impact on house prices over 2018. The Government also plans to cancel next year’s tax cuts, but to spend more over time. It won’t be easy to anticipate the net impact on inflation until the exact policies are published. At this stage, the Reserve Bank is better off waiting and seeing what happens with Government policy, rather than reacting prematurely to policy changes that may or may not eventuate.
Data Previews
RBA November policy meeting
Nov 7, cash rate, last 1.50%, WBC 1.50%
- The RBA is set to meet on 7 November ahead of the Melbourne Cup.
- Since the last meeting in October, momentum in the labour market has remained strong, but household consumption has disappointed materially. This is despite an improvement in consumers’ expectations of the economic outlook. Instead, persistent concerns over family finances are limiting discretionary spending.
- On the housing market, there has been a clear deceleration in Sydney, but Melbourne has held up. Arguably it is still too early to assess the full effect of March’s regulatory reforms.
- Poignant in the October minutes was the clear message that the RBA is not beholden to policy developments (rate hikes) abroad. To our mind, below trend GDP growth and benign inflation will keep them on hold in 2018 and 2019.
Aus Sep housing finance (no.)
Nov 9, Last: 1.0%, WBC f/c: 3.0%
Mkt f/c: 2.0%, Range: 0.0% to 4.5%
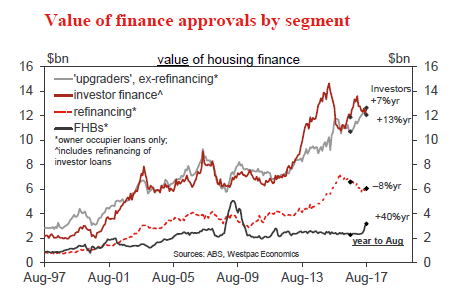
- The number of owner occupier loans rose 1% in Aug, holding flat ex refinance. The value of approvals to investors posted a surprisingly strong 4.3% gain although that is likely being bolstered by investor refinancing activity following macro prudential tightening in late March and associated increases in rates for ‘interest only’ loans (the ABS does not split out ‘refi’ for investor loans).
- Industry data suggests owner occupier loans posted a solid 3% rise in Sep, again suggesting the wider market slowdown evident in other measures is primarily due to a pull back in investor segments. Within the owneroccupier group, first home buyers have also been a notably strong driver in recent months, responding to increased state government assistance.
NZ Q4 survey of inflation expectations
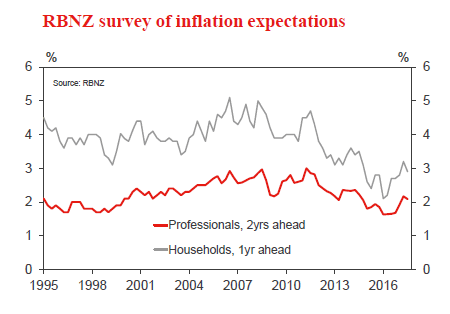
Nov 6, Two years ahead, last: 2.09%, Westpac f/c: 2.1%
- The importance of the Reserve Bank’s survey of inflation expectations has dimmed in recent times, with the RBNZ suggesting that price-setting behaviour has become more backward-looking.
- That said, the survey itself has probably become more backward-looking as well. A change in the schedule means that the survey is now held immediately after the CPI release. CPI inflation rose from 1.7% to 1.9% in the September quarter, a little above market expectations. Consequently, we would expect a small uptick in the survey result, but with the 2% midpoint of the inflation target still providing an effective anchor.
RBNZ Monetary Policy Statement
Nov 9, Last: 1.75%, Market: 1.75% , Westpac: 1.75%
- We expect the RBNZ to keep the OCR on hold and give the same neutral policy guidance that it has given all year. We also expect the OCR forecast to be the same as the August MPS – flat until late 2019 and slowly rising beyond that.
- The economic outlook has deteriorated, and the housing market is weaker than the RBNZ anticipated. But the exchange rate has fallen sharply, meaning the overall outlook for medium term inflation is broadly unchanged. Furthermore, the change of Government makes the economic outlook more uncertain. The RBNZ is better off waiting and seeing how Government policy evolves, rather than making bold changes at this point.
- There would be very little financial market reaction to a neutral MPS along these lines.
NZ Oct retail card spending
Nov 10, Last: +0.1%, WBC f/c: 0.6%
- Retail spending rose just 0.1% in September. While some of this was due to lower than expected spending on fuel, spending on durable goods, clothing and hospitality was down.
- Spending levels have been broadly flat for several months now. In part, this is because of the softness in prices, particularly for imported consumer goods. However, it’s likely that the softening in the housing market is also dampening household spending, particularly for items such as household furnishings. We expect that these same factors will again result in only moderate spending growth of 0.6% in September.
