Key Highlights
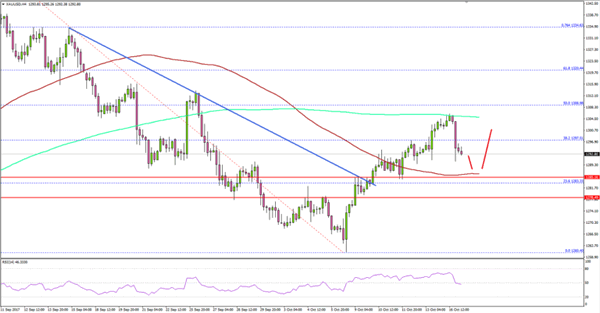
- Gold price after forming a bottom near $1260 against the US Dollar started an upside move.
- There was a break above a key bearish trend line with resistance at $1284 on the 4-hours chart of XAU/USD.
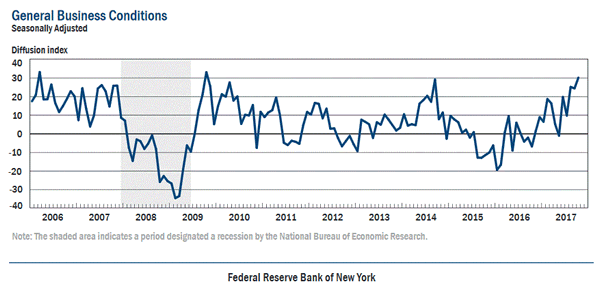
- Recently in the US, the NY Empire State Manufacturing Index posted a rise from 24.4 to 30.2 in Oct 2017.
- Today, the US Industrial Production for Sep 2017 will be released, which is forecasted to increase by 0.2% (MoM).
Gold Price Technical Analysis
Gold price formed a bottom earlier this month at $1260 against the US Dollar. The price is trading in the bullish zone and placed well above the $1285 and $1292 support levels.

Looking at the 4-hours chart of XAU/USD, there was a break above a key bearish trend line with resistance at $1284. Buyers also succeeded in clearing the 100 simple moving average (4-hour, red) at $1285, which is a strong bullish signal.
However, the price recently failed near $1308 and the 200 SMA (4-hour, green). Above the 200 SMA, the next major resistance is around the 50% Fib retracement level of the last decline from the $1357 high to $1260 low. A successful close above $1308 will most likely push the price towards $1320 in the near term.
On the downside, the $1285 level remains a crucial support for buyers along with the 100 SMA.
NY Empire State Manufacturing Index
Recently in the US, the NY Empire State Manufacturing Index for Oct 2017 was released by the Federal Reserve Bank of New York. The forecast was lined up for a decline from the last reading of 24.4 to 20.7.
The actual result was positive as the NY Empire State Manufacturing Index jumped to 30.2, which is the highest level in three years. Looking, at the shipments index, there was a sharp rise of 11 points to 27.5, and the new orders index came in at 18.0.

The report added:
The index for number of employees rose five points to 15.6, suggesting that employment expanded more strongly this month, while the average workweek index registered zero, indicating that the average workweek held steady.
Overall, the result was way above the market expectations and pushed Gold price from $1304 to $1295. Having said that, it seems like the price might continue to gain momentum as long as it stays above $1285.
Economic Releases to Watch Today
- UK Retail Price Index Sep 2017 (YoY) – Forecast +4.0%, versus +3.9% previous.
- UK Producer Price Index Sep 2017 (YoY) – Forecast +3.3%, versus +3.4% previous.
- UK Producer Price Index Sep 2017 (MoM) – Forecast +0.3%, versus +0.4% previous.
- UK Consumer Price Index Sep 2017 (YoY) – Forecast +3.0%, versus +2.9% previous.
- UK Core Consumer Price Index Sep 2017 (YoY) – Forecast +2.8%, versus +2.7% previous.
- Euro Zone CPI for Sep 2017 (YoY) – Forecast +1.5%, versus +1.5% previous.
- Euro Zone CPI for Sep 2017 (MoM) – Forecast +0.4%, versus +0.3% previous.
- Euro Zone Core CPI for Sep 2017 (YoY) – Forecast +1.1%, versus +1.1% previous.
- US Industrial Production Sep 2017 (MoM) – Forecast +0.2%, versus -0.9% previous.
- US Capacity Utilization Sep 2017 – Forecast 76.2%, versus 76.1% previous.
