
 to 3.57%.)
U.S. Highlights
- China’s economy saw solid growth in the first quarter, with a strong rebound in consumption and exports after lockdowns were lifted at the end of last year.
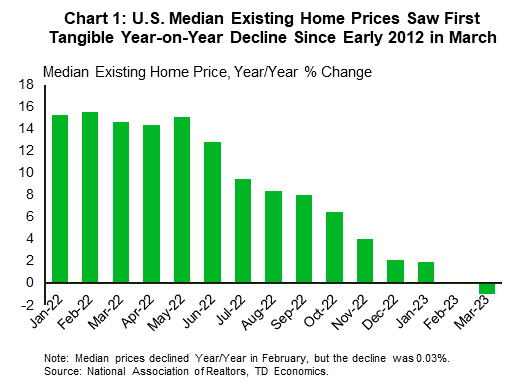
- U.S. existing home sales fell by 2.4% month-on-month (m/m) in March, falling from February’s revised 13.8% m/m uptick as past mortgage rate increases weighed on demand.
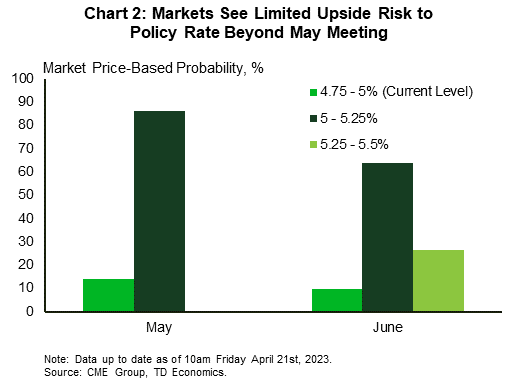
- FOMC members noted that they continue to monitor credit conditions, but many seem to be in favor of further policy tightening at the next meeting in May.
Canadian Highlights
- Canadian inflation continued to ease in March, coming in at 4.3% year-on-year, as energy prices weighed on the overall index.
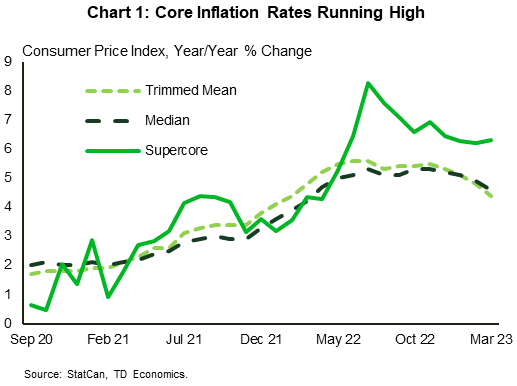
- Core inflation rates also fell, but to a lesser degree, as strength in the Canadian economy has led to an upturn in the cyclical components of inflation (supercore).
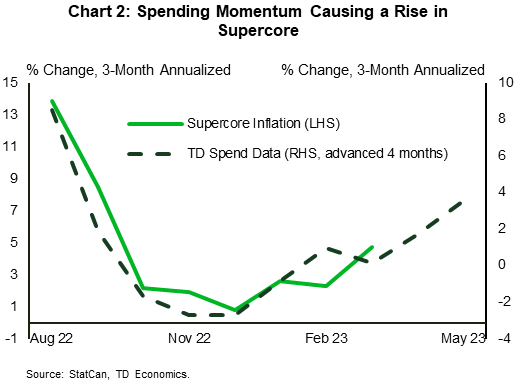
- Although today’s retail sales data showed that Canadians pared back on goods spending, our internal TD data revealed that this was more about consumers shifting to services rather than an outright pull back in spending.
U.S. – Housing Falls as the Fed Blackout Period Begins
As earnings season picked up pace this week, markets were closely attuned to the first quarter performance of U.S. companies. However, the net result on equity markets was muted, as results that were on aggregate moderately positive were partially overshadowed by the downbeat outlook for demand amid the expected economic slowdown later this year. As of the time of writing, the S&P 500 is down 0.5% on the week while the ten-year Treasury yield is up 5 basis-points (bps) to 3.57%.
On the global economic data front, we kicked off the week with first quarter Chinese GDP data, which grew by 4.5% from its year-ago level. The print was better than expected, as pent-up demand from consumers powered growth. China’s economic rebound is expected to be short-lived as consumer exuberance fades and structural headwinds continue to weigh on the economy in the back half of the year.
In the U.S. we had a housing-centric week for economic data, with updates on both existing home sales and residential construction. Data released on Thursday showed that existing home sales fell by 2.4% month-on-month (m/m) in March, pulling back from February’s revised 13.8% m/m increase. Month-to-month changes have been mirroring the volatility seen in mortgage rates (with a lag) as elevated prices have increased the reliance of buyers on financing conditions. While median home prices declined for a second consecutive month relative to year-ago levels (Chart 1), the seasonally adjusted change between February and March was slightly positive. Prices have been held up in part due to low inventory levels. However, new home construction is picking up, with single-family housing starts recovering for a second consecutive month in March, after eleven straight months of declines.
With the Federal Reserve’s pre-meeting blackout period starting on Saturday, we won’t hear from any FOMC members again until Chair Powell’s press conference on May 3rd. Luckily, we heard from ten Fed officials this week, six of whom are voting members. Most of the speakers noted that they were continuing to monitor credit conditions for signs of further stress. The Fed’s regional monitoring in April’s Beige Book stating that “several Districts noted that banks tightened lending standards amid increased uncertainty and concerns about liquidity”. Although this may aid the Fed in tightening credit conditions, as noted by Chicago Fed President Goolsbee this week, most members seemed to agree that further policy tightening would be required to sustainably return inflation to the Fed’s 2% target. As of the time of writing, markets are expecting the Fed to hike by 25bps in May, and then hold in June (Chart 2).
Next week we’ll get a first look at first quarter U.S. GDP and March PCE inflation, both of which are expected to show signs of cooling. Our forecast calls for activity to continue to slow through the remainder of 2023. This should help ease inflation pressures, enabling the Fed to keep the funds rate at 5.25% for the rest of the year.
Canada – It’s a Bird, It’s a Plane, It’s Supercore!
March’s inflation data was under the microscope this week, and it continued its steady deceleration. The headline Consumer Price Index (CPI) was up 4.3% year-on-year (y/y), a significant drop from its reading of 5.2% y/y in February and its peak of 8.1% y/y last June. This trend is likely to continue. We expect that inflation is on course to flirt with the 3% upper bound of the Bank of Canada’s (BoC’s) target range this summer.
So far, headline inflation has cooled largely due to an easing in supply chain bottlenecks and steep decline in commodity prices over the last eight months. As a result, goods inflation has fallen to 3.6% y/y (down from 11.2% in June 2022), while energy inflation has turned negative, at -6.9% y/y. Energy prices are expected to continue to weigh on goods inflation over the next few months. This is the main reason why we are confident that inflation is likely to slow to a 3% pace in short order.
However, the BoC has stated it won’t be happy with 3% inflation. It wants to finish the job and get to 2%. Central bankers typically look at core inflation measures as a guidepost to underlying inflation pressures, since things like food and energy can be volatile. Core inflation has come down, but at a much slower pace than headline inflation. The BoC’s preferred metrics, trimmed mean and median inflation, came in slightly higher than headline CPI, at 4.4% y/y and 4.6% y/y, respectively. The story is more concerning when we look at our index of ‘supercore’ inflation (cyclical inflation in services), which posted a 6.3% y/y print (Chart 1)! If these core metrics don’t start to fall decisively, the BoC will be hard pressed to stabilize inflation at its 2% goal.
Core inflation rates have failed to move lower because consumer spending has seen a revival recently. Labour markets have continued to expand at an average pace of 62 thousand new jobs every month (4 times the trend pace) and governments are supporting peoples’ incomes through debt financed transfers. No wonder our internal TD credit/debit card data have shown that total spending has been on the rise. Spending on services has fueled this growth – rising more than 4% month-on-month (m/m) in February, as Canadians shifted away from spending on goods. In that sense, today’s retail sales data confirmed what we already knew, as retail spending (goods) fell 0.2% m/m in February. As we show in Chart 2, total spending in Canada is surging (Chart 2). And given that consumer demand is the main driver of cyclical inflation, we expect that supercore inflation will keep rising over the coming months.
The BoC is likely concerned about this. Although it has seen a cooling in interest rate sensitive parts of the economy like housing – as evidenced by the 11% drop in housing starts released this week – the cyclical thrust in other areas has intensified. This is likely why Governor Macklem has been reenforcing the message that rates will need to stay higher for longer. Or rather, rates will stay high for as long as it takes for renewed momentum to fizzle out.