U.S. Highlights
- Recent U.S. economic data has been distorted by hurricanes with the volatility likely to persist in the coming weeks. This theme came across this week, with auto sales, ISM indices, trade and payrolls all impacted.
- Auto sales surprised to the upside, as affected consumers begun to replace flood-damaged vehicles. Meanwhile, ISM indices surged, supported by slower supplier deliveries, with some reversal likely ahead.
- The jobs report surprised to the downside, with payrolls falling by 33k, but did include positive elements, such as a declining jobless rate and accelerating wage growth. These reinforced the likelihood of a rate hike by year-end.
Canadian Highlights
- Signs that Canada’s economy is cooling increased this week with data on international trade that showed Canadian export volumes falling 1.9% in August, the third straight month of decline.
- Still, the Canadian job market keeps on chugging. The economy experienced its 10th straight month of job growth with 10k jobs added in September. Since the start of the year, the unemployment rate has fallen 0.7 percentage points and, at 6.2%, is at or close to its long-run structural rate.
- The question of how quickly the Canadian economy can grow is on the minds of monetary policymakers. In a speech this week, Deputy Governor Leduc put his estimate for potential at 1.5%, the top end of the Bank of Canada’s range of 1.0% to 1.6%.
U.S. – Navigating Through Weather-Induced Distortions
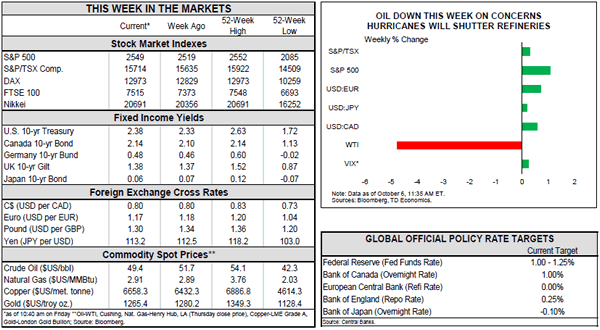
Recently published U.S. economic data has been distorted by Hurricanes Harvey and Irma with the volatility likely to persist in the coming weeks. This theme has been highlighted by this week’s releases, with auto sales, ISM indices, trade, and this morning’s payrolls all impacted by mother nature. Despite the distortions, data this week was constructive, and along with the chance of tax reform has lifted U.S. stock indices to all-time highs.
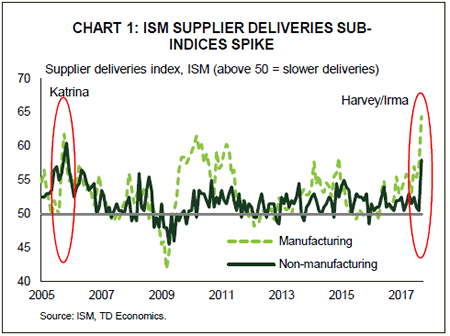
Much of this week’s economic data surprised to the upside. Both ISM indices soared to their highest levels since the mid-2000s. The gains among their subcomponents were broad-based, but the readings were partly supported by slower supplier deliveries (Chart 1) on account of transport infrastructure closures and factory outages. The index typically rises with higher demand, but in this case it increased due to supply constraints, with some reversal likely in the coming months. On the other hand, the surge in auto sales to an impressive 18.5 million annualized units was related to consumers in Texas and Florida replacing flood-damaged vehicles. Alongside the rise in gasoline prices, the increase in auto sales should materialize in a healthy retail sales report next week. Further out, we anticipate replacement demand for vehicles to continue to prop up sales, boding well for durables and overall consumer spending through the end of 2017.
But not all data surprised to the upside. While the nominal trade deficit continued to narrow, export volumes retreated for the second consecutive month. The fact that petroleum exports fell sharply suggests that the Gulf refinery outages played a significant role in reducing export volumes. Having said that, import volumes also retreated as ships were unable to dock and unload at many Texas ports.
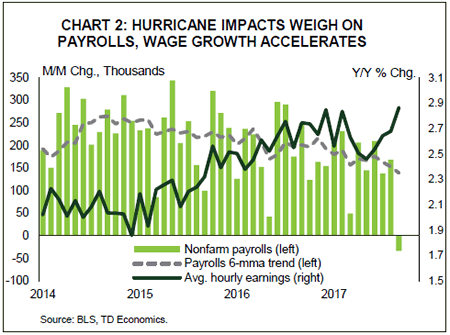
The jobs report was another example of data being affected by hurricanes. Payrolls declined by 33k in September, marking the first contraction since 2010. Results from the prior two months were also revised down a total of 38k, but the 6-month trend was still a healthy 153k pace prior to the recent anomaly. Still, the September report offered positive elements as well. The jobless rate fell to a 16-year low of 4.2%, while wage growth accelerated to 2.9% y/y (Chart 2). July and August were also revised higher to 2.6% and 2.7% respectively from 2.5% y/y initially. The accelerating trend in compensation is very encouraging and bodes well for the inflation outlook. Still, September’s results should be taken with a grain of salt, with some of the wage pressures related to hurricane distortions.
All told, apart from the decline in nonfarm payrolls, the stream of data this week has been better than expected. Importantly, looking past the transitory factors, the economy appears to be on a solid footing. Growth should come in above 2% annualized in the third quarter and near 3% to cap off the year. Declining unemployment and rising wages further reinforce the likelihood that the Fed will hike once more by year end, particularly if these translate into firmer inflation readings. So far, markets are increasingly comfortable with this narrative, with the probability of such an outcome rising to around 90% this morning.
Canada – Coming Back to Earth
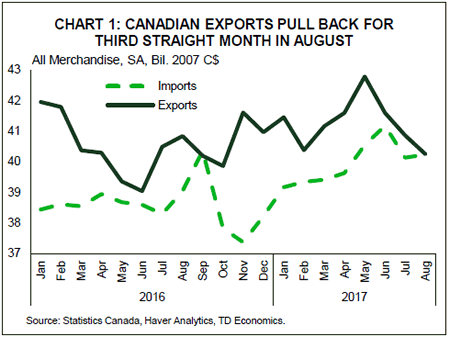
Canada’s economy is cooling from its red hot pace of activity in the first half of the year. This was confirmed this week in data on international trade that showed Canadian export volumes falling 1.9% in August, the third straight month of decline (Chart 1). This data is volatile however, and we anticipate a rebound in the months ahead. Still, with imports eking out small gains in each of the past two months, net-exports are likely to subtract from economic growth in the third quarter, which continues to track slightly above 2.0%.
The softening near-term economic outlook struck a blow to the Canadian dollar, which fell more than half a cent against the U.S. dollar (to just under $0.80 U.S.) as of writing. With growth cooling, the Bank of Canada may be less anxious to raise the overnight rate, satisfied for the time being that the removal of emergency level cuts is enough to take some wind out of the economy’s sails.
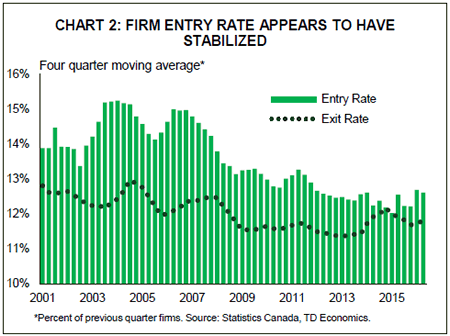
Without a doubt, the question of how quickly the Canadian economy should or can grow is firmly on the minds of Canada’s monetary policymakers. This week, a speech by Deputy Governor Sylvain Leduc noted the deceleration in productivity growth in Canada and offered that a decline in the rate of new firm creation (and destruction) bears some of the blame. As he explained, a key source of productivity growth is the replacement of old firms (and ideas) with new ones. A slowdown in the rate of entry limits this key source of productivity growth.
The good news is that firm entry appears to have stabilized (Chart 2), which would be good news for Canada’s productivity prospects. Measuring the potential growth rate of the economy in real-time is difficult. The recent underperformance in inflation suggests that perhaps Canada’s productive potential isn’t as meagre as it has been made out to be. Indeed, Deputy Governor Leduc put his estimate for potential at 1.5% at the top end of the Bank of Canada’s range of 1.0% to 1.6%.
The notion that Canada is awash in underutilized resources, however, is hard to square with the data on the Canadian labour market. In September, the Canadian economy experienced its 10th straight month of job growth (+10k). Since the start of the year, the unemployment rate has fallen 0.7 percentage points and, at 6.2%, is at or close to its long-run structural rate. Moreover, any worries about the composition of job growth favouring part time work should be assuaged by September’s report in which full-time jobs rose 112k and part-time fell 102k. This was enough to push aggregate hours worked up 2.4% year-on-year, well above its estimated trend rate of under 1%.
All this means that even as the Canadian economy comes back down to earth, growth of around 2.0% is likely sufficient to put gradual upward pressure on inflation and keep the Bank of Canada in tightening mode. Still, as long as there is some uncertainty around the potential economic growth rate as well as the impact of hikes already in the pipeline, the central bank can go slow. We still expect one more hike before this year is out, but anticipate a slower pace of hikes next year, with just two more before the end of 2018.
U.S.: Upcoming Key Economic Releases
U.S. Consumer Price Index – September
Release Date: October 13, 2017
Previous Result: 0.4% m/m, core 0.2% m/m
TD Forecast: 0.6% m/m, core 0.2% m/m
Consensus: 0.6% m/m, core 0.2% m/m
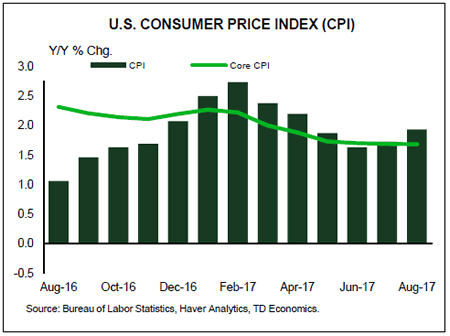
We expect headline CPI inflation to pick up to 2.3% y/y in September, with prices up 0.6% m/m. Energy prices will exert an even larger contribution this month led by an 11% bounce in gasoline prices. Food prices could also see stronger gains from crops affected by Hurricane Irma. But outside of food and energy, we expect price impacts to be minimal as was the case in past hurricane episodes. Nonetheless, we expect a solid 0.2% print in the core CPI, keeping the core inflation rate stable at 1.7% y/y with upside risk for a firmer 1.8% pace. The September data will be widely scrutinized by Fed officials, particularly by those who are still on the fence over a December rate hike based on the past disappointment in inflation this year. A second consecutive 0.2% rise in core inflation will help build the conviction that price pressures are finally picking up as transitory factors dissipate.
U.S. Retail Sales – September
Release Date: October 13, 2017
Previous Result: -0.2%, ex-auto 0.2%
TD Forecast: 1.7%, ex-auto 1.1%
Consensus: 1.4%, ex-auto 0.9%
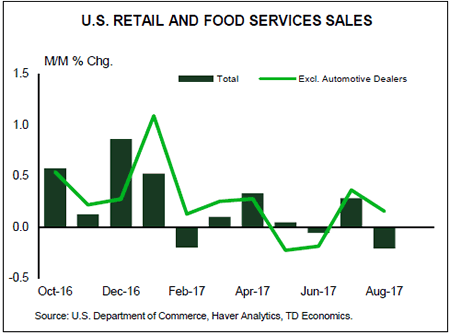
We expect a strong 1.7% increase in September retail sales, reflecting a hurricane-induced surge in demand concentrated in motor vehicles. New vehicle sales massively beat expectations in September, hitting a 12-year high of 18.5m units, or a 15% m/m increase, as consumers affected by the twin hurricanes looked to replace their damaged vehicles. Industry estimates suggest that sales have further room to run; over 500k vehicles were damaged by the storms, propping up demand at least through November. Meanwhile, the sharp jump registered in gasoline prices following Hurricane Harvey should lend a boost to gasoline station receipts. Other categories such as building materials could see a boost as well, such that we see scope for a 0.5% rise or higher in the core control group (excluding auto, gasoline station, food services and building material sales). The report would leave Q3 real PCE tracking near a 2% pace.
Canada: Upcoming Key Economic Releases
Canadian Housing Starts – September
Release Date: October 5, 2017
Previous Result: -$3.04bn
TD Forecast: -$2.7bn
Consensus: N/A
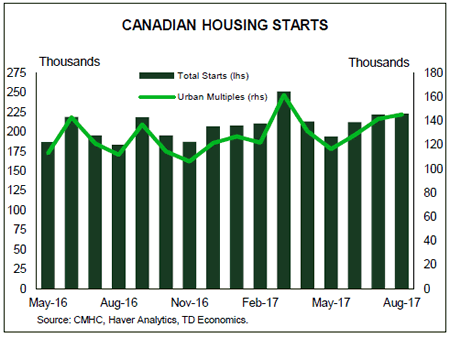
We look for housing starts to moderate to 212k units in September vs 223k in August. That would leave Q3 as a whole up 6% over Q2. We look for the September dip to be led by multi-family units, with scope for higher single-family starts to partially offset. An overall drop in September is also likely to be driven by starts in Ontario, which came back strongly in the prior two months.
