U.S. Review
Housing Data Slide, but Factory Sector Firms
- U.S. housing data released this week came in on the soft side, as new home sales and pending home sales were both weakerthan- expected. Amid a low inventory environment, home price growth remained firm.
- Capital goods orders were strong in August, an encouraging sign for business investment and the factory sector.
- Consumer confidence in September was dinged by Hurricanes Harvey and Irma, but only modestly so.
- On the inflation front, price growth was weaker-than-expected in August based off of the PCE deflator.
Housing Data Slide, but Factory Sector Firms
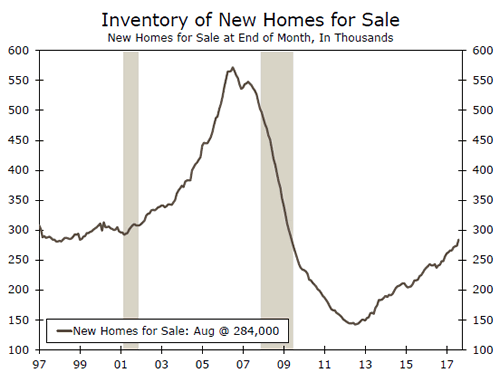
Housing data kicked off the week in what was a relatively light data week in the United States. New home sales fell 3.4 percent to a 560,000-unit annualized pace in August. The Houston metro area accounts for about 5 percent of new home sales, providing an indication of the magnitude of hurricane-related disruptions. Inventory of new homes for sale at the end of the period spiked in August, largely in the South. Most of the increase was in homes not yet started or under construction, which is consistent with earlier reported data on completions, which fell sharply.
The inventory of both completed new and existing homes for sale remains near historic lows (top chart). The lean inventory has weighed on home sales in the United States. We also learned this week that pending home sales fell a larger-than-expected 2.6 percent in August, the fifth drop in the past six months and a sign that existing home sales will likely continue to slide during the next few months. Amid this lean inventory environment, home price growth has been firm. The S&P CoreLogic Case- Shiller National Home Price Index rose again in July and is up 5.9 percent over the year, continuing the steady price gains of 5-6 percent seen over the past few years.
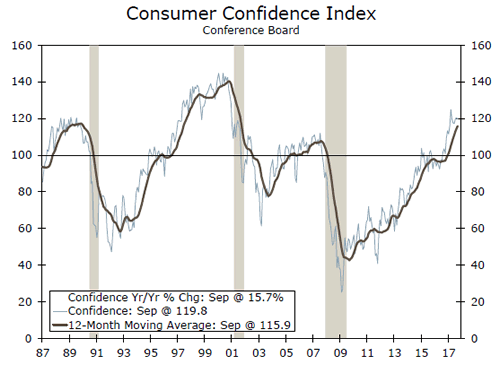
September consumer confidence was also dinged by hurricane effects, but only modestly so. Consumer confidence fell 0.6 points in September from August’s downwardly revised reading (middle chart). The decline was concentrated in the present situation component, however, as expectations for the future were stronger in the month. The Conference Board noted that "confidence in Texas and Florida decreased considerably," as those two states were most severely impacted by the hurricanes. On balance, despite the hurricane effects and limited progress on economic policy from federal policymakers, consumer confidence has continued to hover at a relatively high level after surging in the wake of last November’s presidential election.
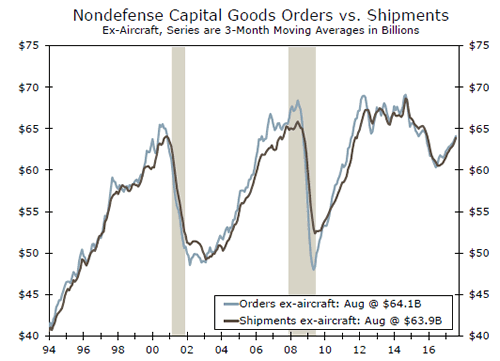
Durable goods orders were the notable bright spot this week. Durable goods orders rose 1.7 percent in August, aided in part by a bounce back in the notoriously volatile aircraft orders component. New orders for nondefense capital goods excluding aircraft, our preferred measure of business investment plans, rose a strong 0.9 percent in August, bringing the three-month average annualized pace of growth to a healthy 6.4 percent. The regional purchasing managers’ indices released thus far this month have all also improved, with new orders expanding at a faster clip according to the New York, Philadelphia, Richmond and Dallas Fed manufacturing surveys. As the chart on the front page illustrates, spending on core capital goods has finally turned the corner after a steep slide that began in early 2015.
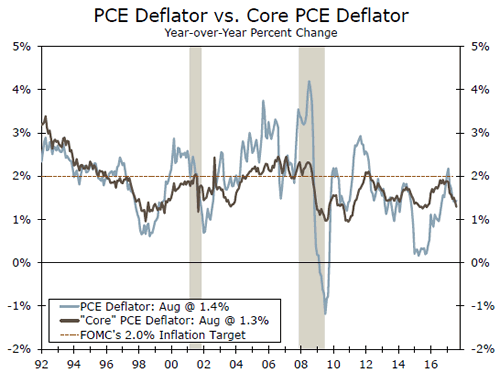
Personal income & spending met a relatively low bar in August, with spending rising 0.1 percent over the month. Inflation, as measured by the PCE deflator, was 0.2 percent in August and 1.4 percent a year-ago (bottom chart). Excluding food and energy, the core PCE deflator rose just 0.1 percent and, at 1.3 percent year over year, it is at its lowest point in two years. Inflation continues to remain quite tame headed into the final quarter of 2017.
U.S. Outlook
ISM Manufacturing • Monday
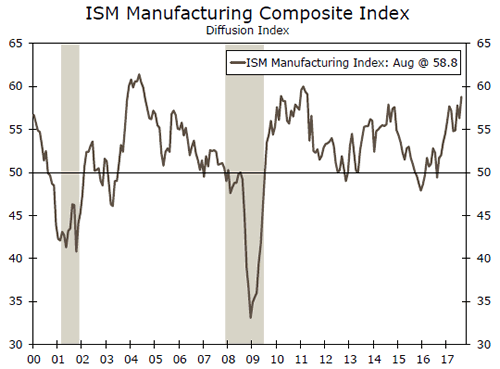
The ISM manufacturing index hit its highest level in six years in August. Recent data from the factory sector has finally started to align after hard and soft sources posted conflicting signals during the first half of 2017. We take the high point in August as assurance the manufacturing sector is making progress toward its recovery from 2015-16 when slow global growth, inventory drawdowns, oil price declines and the strong dollar formed a perfect storm for the factory space. Now it seems the sector is enjoying the weather.
However, actual weather over the past month likely had some sort of impact on business conditions for ISM respondents. Hurricanes disrupted supply chains which likely caused increases in prices paid and supplier lead time. New orders were likely slowed for most, while some producing goods used in construction or repairs may have seen orders spike. Still, the solid string of factory reports prestorm indicates the factory sector will weather disruptions in H2.
Previous: 58.8 Wells Fargo: 58.2 Consensus: 58.0
Factory Orders • Thursday
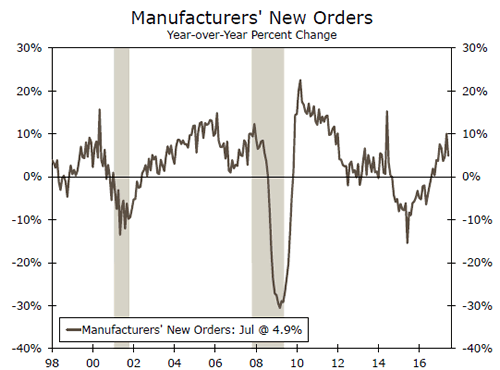
The historic month of hurricanes slamming into the Southeast over the past month will undoubtedly make interpreting incoming data over the next few months more difficult. Factory orders are not immune, though we still expect orders rebounded in August mostly due to the volatile aircraft component driving July’s decline. The durable goods report this week was also positive, even excluding aircraft. The solid showing for core orders highlights the recovery in the factory sector was going strong when the storms hit. Harvey made landfall on August 26, so we expect most of the hurricane impacts to begin showing in the orders and shipments data starting in September.
The solid string of performances over the last few months gives us confidence that manufacturers had built up a solid cushion that will help to offset hurricane-caused weakness elsewhere in Q3.
Previous: -3.3% Wells Fargo: 0.7% Consensus: 0.9% (Month-over-Month)
Nonfarm Payrolls • Friday
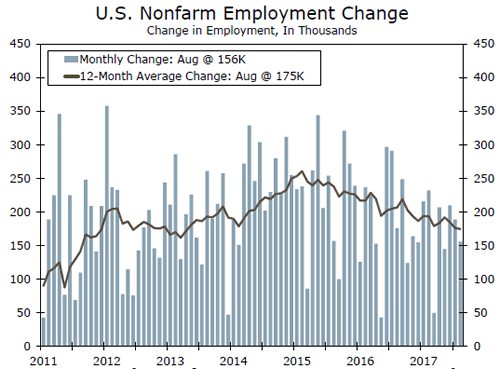
The BLS measures employment during the week that contains the 12th of the month, so Hurricane Harvey hit Texas too late in August to be reflected in that months’ report. August’s gain of 156,000 jobs with a 4.4 percent jobless rate reflected the continued strength in the labor market before major hurricanes shut down two critical states to the U.S. economy.
Any differences in Texas’ payroll levels, hours worked or labor force status that resulted from Harvey will be caught in the September jobs number next week. Irma shut down the state of Florida during the heart of the survey period. Consensus estimates no change in the jobless rate and a monthly payroll gain of 75,000. We think that is optimistic and are calling for an uptick in the unemployment rate to 4.5 percent with a monthly gain of 55,000 jobs. Be wary if wages surge; it might just reflect fewer hourly workers able to make it to work, removing some lower wage positions from the calculation.
Previous: 156K Wells Fargo: 55K Consensus: 75K
Global Review
Implications of the German Elections for the Eurozone
- Voters returned Angela Merkel to the chancellorship of Germany for her fourth term. However, it hardly will be smooth sailing ahead for Merkel due to the presence of a far right party in the new Bundestag and gaping ideological differences among Merkel’s potential coalition partners.
- French President Macron has given new hope to proponents of EMU reform, but the electoral results in Germany have thrown some cold water on those hopes. Financial markets in the euro area are stable at present. However, volatility could rise anew if economic shocks buffet the euro area before the architecture of EMU is reformed.
Implications of the German Elections for the Eurozone
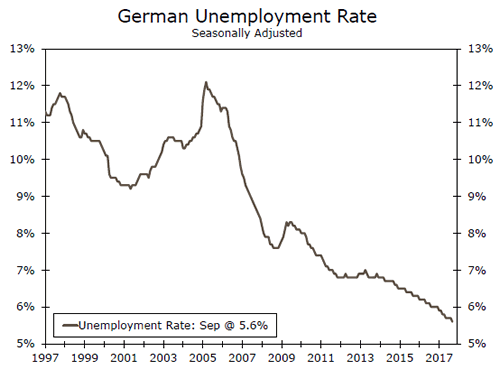
Voters in Germany went to the polls on September 24 and returned Angela Merkel to the chancellorship for her fourth term. In some sense, the result was not very surprising. The German economy has been expanding steadily for the past four years, and the unemployment rate has dropped to its lowest level in the post-reunification period (top chart).
However, the electoral results were not all positive for Chancellor Merkel. Yes, Merkel’s Christian Democratic Party (CDU) won a plurality with 33 percent of the votes cast. However, this percentage was down sharply from the 42 percent the CDU received in 2013. Moreover, Alternative für Deutschland (AfD) garnered 13 percent of the vote, which means a far-right party will be represented in the Bundestag (the lower house of German parliament) for the first time since the end of World War II.
The center-right CDU has governed Germany in a "grand coalition" with the center-left Social Democrats (SDU) over the past four years. However, following the electoral debacle suffered by the SDU—its vote share fell to a post-WWII low of 21 percent— party leaders said they would not enter into another "grand coalition." In order to govern effectively, the CDU needs to form a coalition with other parties. The CDU has said that it will not govern with the AfD, which essentially leaves the Free Democrats (FDP) and the Greens as potential partners. However, there are big ideological differences between the economically liberal FDP and the environmentally conscious Greens. Forming a coalition will not be easy.
Reforms to the architecture of European Monetary Union (EMU) will be one area of philosophical tension among potential coalition partners. The election in May of Emmanuel Macron as the president of France gave new hope to proponents of EMU reform. Macron has proposed that centralized fiscal authorities should have a larger budget that can be used to stabilize economic growth when shocks hit the Eurozone, and he also has called for a deeper banking union among the 19 economies of the euro area. Chancellor Merkel had expressed some interest in these reforms prior to the German election. However, the FDP is not in favor of deeper EMU integration. It may be difficult for Merkel to make a deal with Macron if the FDP is part of the governing coalition in Germany. In addition, the presence of the EMU-loathing AfD in the Bundestag will pull debate in that legislative chamber further to the right.
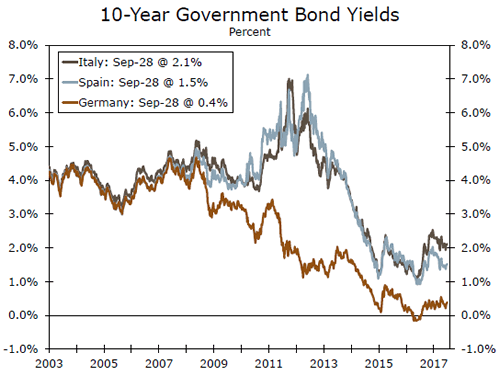
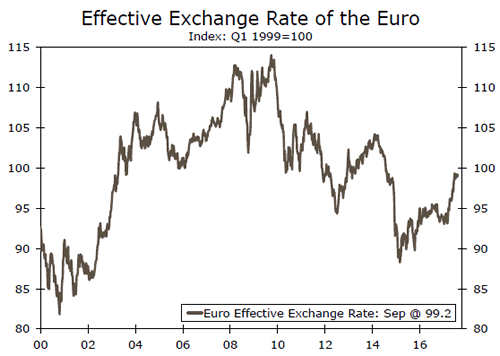
For now, financial markets in the euro area generally remain buoyant. Spreads on Spanish and Italian government bond yields relative to their German counterparts, which tend to widen whenever there is financial market tension, have been stable (middle chart). The euro, which has trended higher versus most major currencies this year, has shown little signs of weakening (bottom chart). But the wide discrepancy in unemployment rates in the euro area (see chart on front page) is a stark reminder that the EMU is far from being "fixed." Financial market tension could rise anew if economic shocks buffet the euro area before the architecture of EMU is reformed. Stay tuned.
Global Outlook
RBA Meeting • Monday
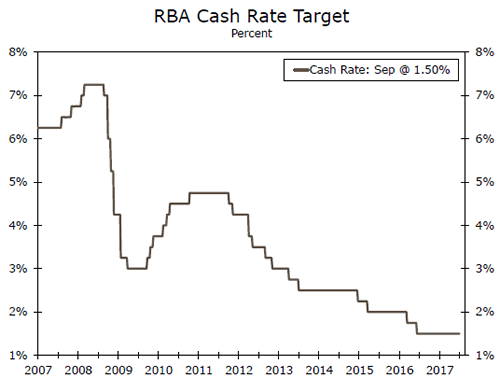
The Reserve Bank of Australia (RBA) has kept its official cash rate at 1.5 percent for a little over a year now. As we wrote in a previously published piece with our colleagues in the currency strategy group, Catch-22, the RBA is faced with balancing rising consumer debt amidst a run-up in home prices. What has arguably changed in the roughly five months since we published that report is that there are signs of firming in the Aussie economy.
Acknowledging this dynamic, the latest official statement from the RBA noted, "[t]he recent data have been consistent with the Bank’s expectation that growth in the Australian economy will gradually pick up over the coming year." With inflation still low and wobbly fundamentals in housing, we still see the RBA on hold well into 2018. So while we expect no change in the Cash rate next week, we will watch for indications of a tightening bias look for cues on timing when the official statement prints on Monday.
Previous: 1.50% Wells Fargo: 1.50% Consensus: 1.50%
U.K. PMIs • Monday and Wednesday
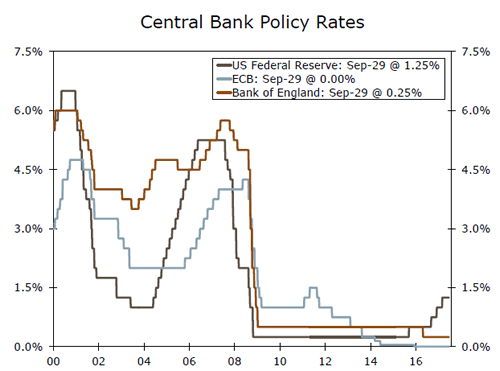
Speaking of central banks, the Bank of England is on hold as well and, we expect it will refrain from increasing rates until well into 2018. That accommodative monetary policy stance is helping to underpin economic activity in the United Kingdom, but some measures of business spending have softened.
In fact, until some of the uncertainty surrounding the Brexit process is cleared up, businesses may take a "wait-and-see" approach which could hinder investment spending.
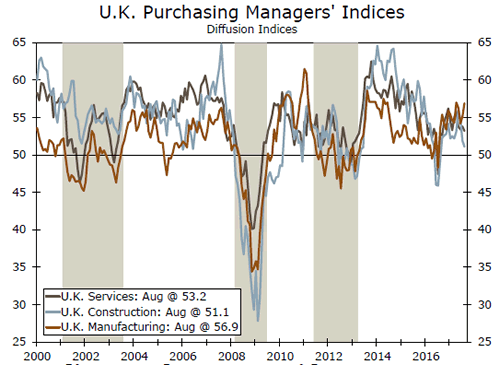
We will get some survey data on the state of the British business sector next week when the manufacturing PMI comes out on Monday and the service-sector counterpart is released on Wednesday. While both measures have bounced off their post- Brexit lows, the momentum has weakened more recently.
Previous: Manufacturing: 56.9, Services: 53.2 Consensus: Manufacturing: 56.2, Services: 53.2
Canadian Employment • Friday
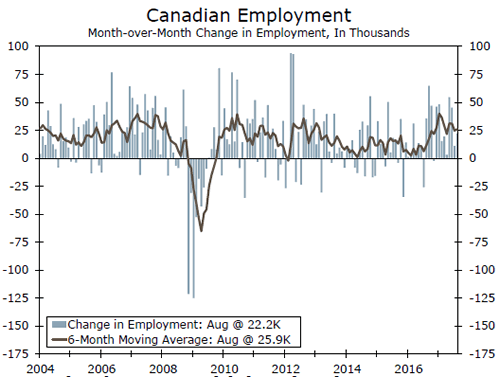
Over the past year or so, Canada’s labor market has been adding jobs at about as fast a rate as it has at any point in the past decade or so. While monthly jobs number can be notoriously volatile in Canada, the 6-month moving average plotted in the graph at right shows sustained job growth north of 25K for the better part of the past year. September jobs numbers come out on Friday and will give a contemporary read on how the labor market finished out the third quarter.
Canada’s GDP growth in each of the first two quarters of 2017 was the fastest of any of the G-7 economies, an outcome that not too many forecasters expected at the start of the year. The better-thanexpected outturn is partly a function of low base-effects after a retrenchment in business spending in 2015 and 2016 along with a rebuilding of inventories. We worry that without those supports, growth in Canada will moderate in the second half.
Previous: 22.2K
Point of View
Interest Rate Watch
Yellen Ponders Inflation
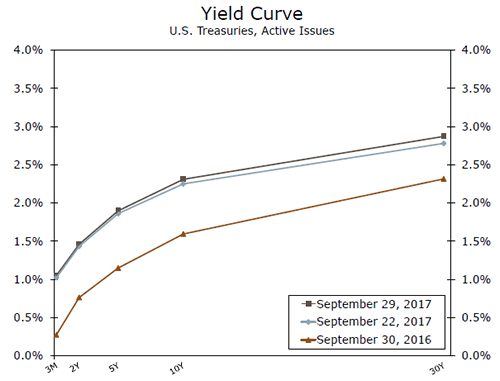
Weaker inflation since the start of the year has been a source of doubt about whether the FOMC would carry on with its campaign to normalize policy in the months ahead. In a speech this week, Fed Chair Janet Yellen focused on the recent slowdown and three areas of uncertainty surrounding key assumptions to the inflation outlook.
First, many policymakers’ framework for inflation continues to rest on the degree of slack in the labor market. While labor conditions continue to tighten, the Fed Chair acknowledged that there might be more slack than currently estimated, indicating the labor market is further away from full employment—and therefore upward pressure on wages—than currently estimated.
Second, long term inflation expectations may not be consistent with the Fed’s 2 percent inflation target. Although the FOMC has routinely touted long-term inflation expectations as well anchored, expectations have slipped the past couple of years which would make it harder for inflation to strengthen.
Third, there may be a more fundamental problem in that the current framework for inflation may me missing a key factor. The possibilities range from the importance and non-macro considerations for healthcare prices, global rather than domestic resource slack, and the role of e-commerce in price setting.
Pressing On
While these sources of uncertainty for the inflation outlook are likely to persist in the coming months, they do not appear to warrant the FOMC hitting the brakes on tightening. Yellen highlighted that FOMC members still anticipate that inflation will strengthen toward the committee’s target and emphasized the risks to the labor market and financial stability of moving too slowly.
Therefore it appears that an additional rate hike later in the year is still on. Indeed, the probability of rate hike in December jumped following her speech and currently sits at 67 percent.
Credit Market Insights
Consumer Outlook Remains Stable
The Federal Reserve Bank of New York’s Survey of Consumer Expectations (SCE) for August points to generally positive consumer conditions across the three survey categories of inflation, labor market, and household finance.
Consumers’ inflation expectations remained the same at the one-year time horizon, while one-year ahead home and gasoline price change expectations ticked up slightly over the month. Expectations of earnings growth moved lower in August. However, the probability that the unemployment rate will be higher a year from now declined to 35.4 percent, the lowest reading since February 2015.
Perceived credit availability was slightly lower for the majority of respondents in August. However, fewer respondents reported credit as "much harder" to obtain a year from now, and an increased share of respondents reported credit as "much easier" to obtain a year from now.
Respondents had a generally positive outlook for overall household finances, with expectations of being financially better off a year from now up 13 percent on a year-ago basis. Steady projections for rate increases at last week’s FOMC meeting and the Republican tax reform framework released earlier this week will likely influence expectations on changes in interest rates and taxes in next month’s survey. For now, the consumer outlook remains relatively stable.
Topic of the Week
Quantifying the Housing Recovery: Which MSAs Are Experiencing Bubbles?
The housing market is one of the most cyclical components of the U.S. economy and played a leading role in the Great Recession. While house prices have recovered, the extent of the recovery varies considerably across markets. Some markets have fully or even more than fully recovered, while others have lagged. Our recent study analyzes house prices across different markets and helps decision makers design appropriate policies to reduce the potential fallout from another housing bubble.
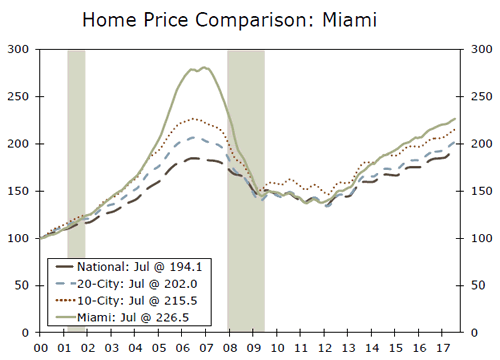
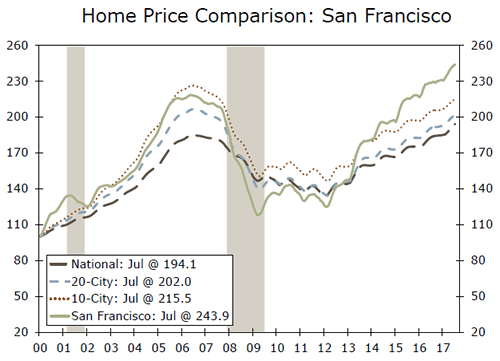
We utilize three different methods to evaluate housing prices in 20 MSAs along with three different measures of national home prices. Our first method characterizes MSA HPIs as having consistent or inconsistent behavior. That is, if an MSA’s HPI stays above/below the national HPI line then we can call that a consistent behavior, otherwise it exhibits inconsistent behavior. For example, Miami’s HPI shows a consistent behavior (top graph) while house prices in San Francisco MSA show an inconsistent behavior in our analysis (bottom graph). We find that 12 out of 20 MSAs show a consistent behavior, while 8 cities’ house price indices are characterized as having inconsistent behavior.
Our second method found structural breaks in all the HPI series, which confirms different HPI series behave differently in our sample period. Furthermore, some MSAs, such as New York and Miami, began to recover much sooner than other MSAs, which may suggest that some regions lead the housing market. Finally, the Granger causality test results suggest certain MSAs are leading the national average and most of the other MSAs house markets. The leading MSAs markets are Las Vegas, Los Angeles, Miami, New York and San Francisco.
In sum, our study suggests leading behavior for some MSAs, which indicates that changes in the housing markets of these MSAs would provide an early warning for prices at the national and regional levels. Decision makers can closely watch activities in the leading markets to gauge and predict the near future path of the national housing market. In addition, the extent to which conditions overheat in these leading housing markets may provide important clues about how much prices will overshoot nationally.
