U.S. Review
Balance Sheet Plan Commences in October
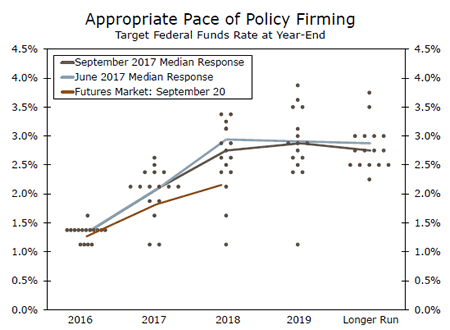
- The FOMC announced this week that it will start balance sheet normalization in October. The dot plot leaves open the possibility of another rate hike in 2017, but implies one less move in 2019. Officials also pushed out expectations to hit the 2 percent inflation target into 2019.
- The economic calendar focused heavily on housing this week. The key takeaway was largely that the inventory shortage was already straining the market, and the outlook for alleviating that strain with new construction was limited by major storms damaging vital southern markets, repairs for which will likely take precedence in coming months.
The Fed Signals the Beginning of the End
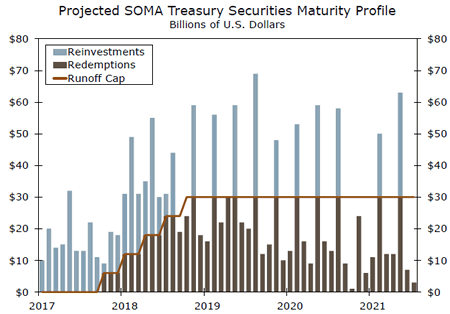
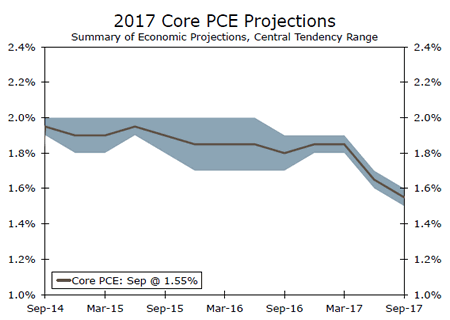
The Federal Reserve left rates unchanged in September, as was widely expected. There were several new developments, however. The committee will initiate the balance sheet draw-down in October. The plan is to only reinvest principal payments above a cap, which will start at $10 billion per month and increase every three months (economic conditions warranting) until the cap is $50 billion. The Fed is comfortable with the strength of the U.S. economy. In the September Summary of Economic Projections, participants expect stronger real GDP growth in 2017, with the median projection rising to 2.4 percent from 2.2 percent at the June meeting. Member projections also centered on a slightly higher pace in 2019 than in June, now anticipating a 2 percent medium-term growth rate. Persistently disappointing inflation readings brought the central tendency for core PCE down again, and the committee now expects inflation to take longer to hit the 2 percent target, which they expect will happen in 2019 rather than 2018. We are less optimistic and calling for 1.8 percent PCE growth in 2019. The FOMC made clear in the statement that temporary negative shocks from hurricanes are unlikely to derail economic growth materially in the medium term. The dot plot did not take another rate hike in 2017 off the table but did remove one from 2019. However, we still doubt the FOMC will be able to raise the funds rate as quickly as their dot plot implies in 2018.
Relatively Calm Before the Storm in Housing
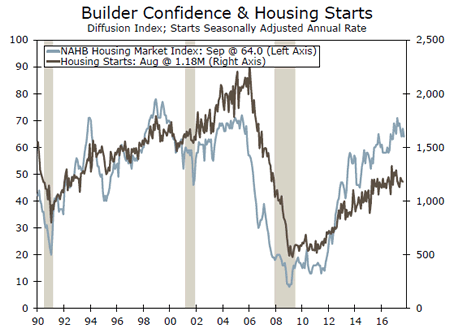
The NAHB/Wells Fargo Housing Market Index fell 3 points in September as Hurricanes Harvey and Irma hit the two largest states for homebuilding, understandably dampening confidence for homebuilders. Florida and Texas were 25 percent of the single-family homebuilding market through July. The absence of that substantial activity in coming months will certainly be felt, and the corresponding demand for construction materials and labor to rebuild is likely to have ripple effects in unaffected markets in the form of higher construction costs. The storms have effectively put a pause on important housing market activity for the next few months, though demand and activity is likely to recover by the end of the year and 2018 will likely be stronger.
Housing starts have moderated in recent months relative to Q1. Starts in July were actually stronger than first reported, which resulted in an unexpected decline in August as those estimates were based on a lower July base. Beyond the month-to-month changes, starts have been much stronger for single-family than multifamily this year. Apartments have seen a great deal of supply come on the market in many parts of the country, cooling new construction. Single-family starts are in for a soft patch in coming months.
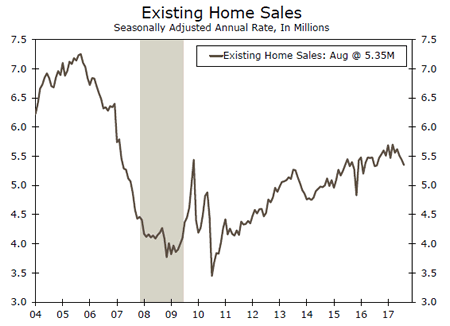
Sales of existing homes have also moderated, as strong demand continues to run up against lean inventory. August existing sales were also slightly impacted by Harvey, which arrived towards the end of the month and likely delayed some contract closings. Existing sales in September will give a better idea of the storm impacts, as 20 percent of the nation’s existing home sales through the first half of 2017 were in Florida and Texas.
U.S. Outlook
Consumer Confidence • Tuesday
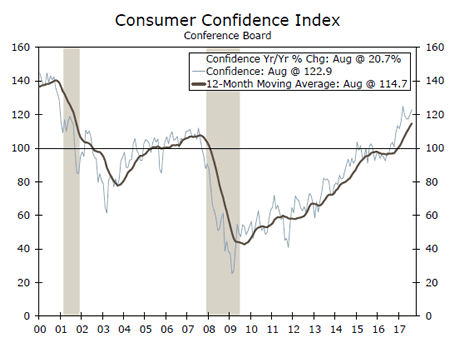
The Conference Board’s measure of consumer confidence climbed again in August and, at 122.9, was just shy of its cycle peak set back in March. Steady progress in the labor market has supported households’ views of the economy.
The cutoff date for the August survey was the 16th of the month, and therefore did not reflect the impact of Hurricane Harvey. With Hurricane Irma hitting Florida in early September, we expect to see confidence decline in next week’s reading as the damages and disruptions erode views of business conditions. Beyond the directly impacted areas, the spike in gasoline prices linked to the storms is also likely weigh on confidence in the near term. As with previous severe storms, however, we expect related weakening to be short lived.
Previous: 122.9 Wells Fargo: 120.3 Consensus: 119.5
Durable Goods • Wednesday
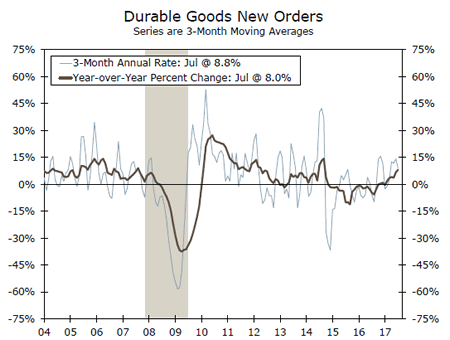
Durable goods orders have been whipsawed even more than usual the past two months by a surge and subsequent unwinding of aircraft orders. Through the volatility, however, capital goods spending has improved. Orders for nondefense capital goods orders ex-air rose 1.0 percent in July, raising the three-month average annualized rate to 5.1 percent.
We expect to see a moderate rise in durable goods orders for August. While overall manufacturing production fell last month according to the Fed’s industrial production report, the drop was due to a pullback in nondurables. Durables production rose last month, as did employment for the sector. With manufacturing PMIs also heading higher in August, we expect durable goods orders to have risen 0.4 percent last month.
Previous: -6.8% Wells Fargo: 0.4% Consensus: 0.9% (Month-Over-Month)
Personal Income • Friday
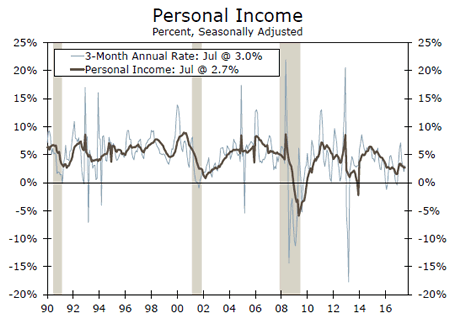
Personal income growth started the third quarter on solid footing, with income rising 0.4 percent in July. We expect to see a more modest 0.3 percent rise in August following slower job and average hourly earnings growth.
Low inflation in July helped to support real disposable income growth as well as real spending. August inflation, however, is likely to take a bigger bite out of income. Consumers faced higher gasoline prices in August even before the month-end spike caused by Hurricane Harvey, while the Consumer Price Index points to a pickup in core inflation. We expect to see PCE inflation, the Fed’s preferred inflation gauge, rise 0.3 percent for August.
Previous: 0.4% Wells Fargo: 0.3% Consensus: 0.3% (Month-Over-Month)
Global Review
BoJ Chooses to Swim Against the Tightening Tide
- Unlike many of the world’s other major central banks, the Bank of Japan (BoJ) showed no signs of turning off the stimulus spigot at its policy meeting this past week.
- Eurozone purchasing manager indices signaled faster growth in September, as both the manufacturing and service sector measures rose.
- The Canadian consumer price index showed signs of modest acceleration in August as headline and core measures were all in the ballpark of 1.5 percent year-over-year.
BoJ Chooses to Swim Against the Tightening Tide
As the Federal Reserve made the historic decision to begin unwinding its balance sheet, the Bank of Japan quietly elected to keep its cocktail of stimulus programs unchanged in an 8-1 vote, with the lone dissent coming for dovish rather than hawkish reasons. The move comes amid a broad shift in sentiment by many of the world’s other major central banks as economies in the developed world have begun to accelerate in tandem, lessening the need for the extraordinary monetary policy stimulus adopted over the past few years.
Economic growth in Japan has actually been relatively strong in recent quarters, at least by Japanese standards. Japan’s economy expanded at an annualized pace of 2.5 percent in the second quarter, and in so doing it extended the number of consecutive quarterly expansions to six—the longest winning streak in more than a decade (see chart on front page). Our fullyear forecast for real GDP growth in Japan is 1.9 percent, which would be the fastest pace since 2013.
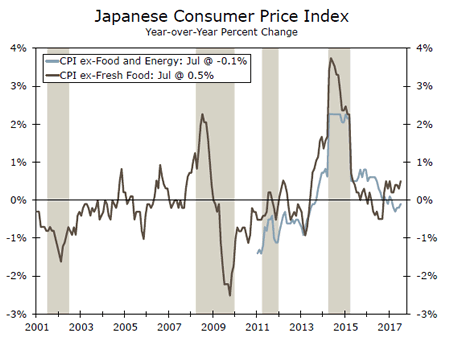
The key challenge for the Bank of Japan is the continued lack of inflation. The consumer price index (ex-fresh food) in Japan was up just 0.5 percent year-over-year in July, and prices were in deflationary territory ex-food and energy (top chart). The BoJ is steadfast in its commitment to achieving what has been a fleeting objective for a generation: sustained inflation of 2 percent. Japan has struggled with slow growth and inflation more than most other advanced nations, and as a result its central bankers are resolutely committed to banishing its deflationary demons. Thus, we believe the BoJ will remain committed to its accommodative monetary policy measures for now even as the Fed, European Central Bank and others tilt in a more hawkish direction.
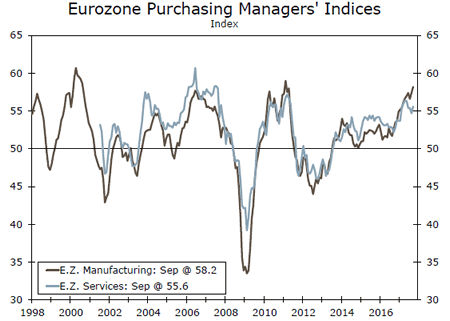
Purchasing managers’ indices for the Eurozone continued their ascent in September (middle chart). The survey-based data showed activity strengthening in both the service and manufacturing sectors, with the manufacturing reading approaching levels not seen since the rebound from the Great Recession in 2010. Real retail sales in the United Kingdom also posted a beat, rising much faster than consensus expected in August. Non-store retailing growth continued surging, rising 5.0 percent over the month. Although it is only one month’s print, the U.K. economy has been one of the few laggards in the developed world, and any signs of an improvement in economic activity are encouraging.
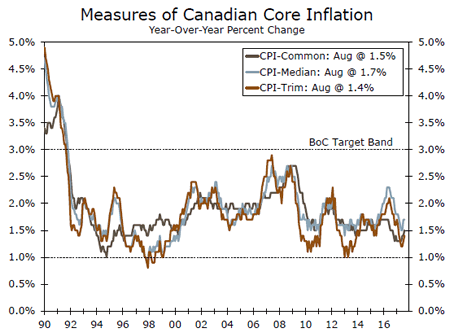
The Canadian consumer price index showed signs of modest acceleration in August. Headline and core measures were in the ballpark of 1.5 percent year-over-year, well within the Bank of Canada’s (BoC) 1-3 percent target band for inflation. The Bank of Canada has hiked rates twice this year amid a pick-up in economic growth that has driven year-over-year real GDP growth to 3.7 percent as of Q2. With two meetings left this year, BoC officials will be watching closely to see if the acceleration in the economy is followed by further acceleration in prices. Thus far, price growth appears quite tame.
Global Outlook
Germany IFO • Monday
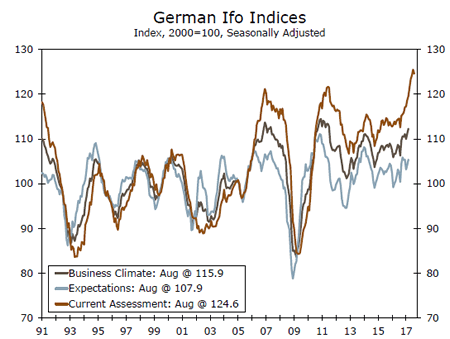
The week will start with a packed schedule of releases from some of the strongest and largest global players today. From Germany we will get the IFO business climate, expectations, and current assessment indices for September. Although these indices are qualitative surveys in nature, they have been pointing to an improved environment for the German economy in the third quarter of the year. In fact, the business climate index registered the highest reading for this index in July, at 116.0 while declining slightly to 115.9 in August. Thus, another strong reading will be supportive of a relatively strong German economy. The other two indices have also been higher in the third quarter with the current assessment index also hitting a series high in July of this year. Meanwhile, on Thursday markets will have an opportunity to look at the GfK consumer confidence index for October, with this index hitting a series high of 10.9 in September of this year.
Previous: 115.9 Consensus: 116.0
China Manufacturing PMI • Thursday
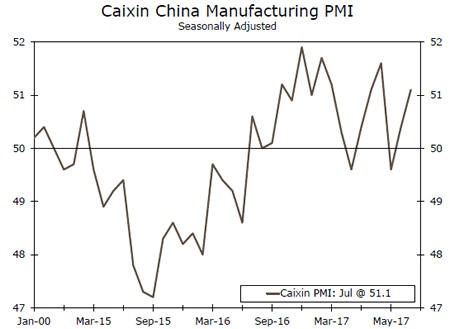
Although Chinese economic growth has slowed down considerably since the hay days of double-digit growth, what happens in China doesn’t stay in China, and the country’s numbers continue to drive expectations about the global economy. On Thursday and Friday, markets are going to get a chance to look at the state of the Chinese manufacturing sector in September with the release of the Caixin manufacturing PMI on Thursday and the official manufacturing PMI on Friday. The first one measures more closely manufacturing activity of smaller, privately owned firms and the official one measures mostly operations of large state owned enterprises. The good news is that both indices have moved above 50 and have continued to slowly improve during the last several months, and a further improvement could suggest better prospects for global economic growth.
Previous: 51.7 Consensus: 51.7
Japan Industrial Production • Thursday
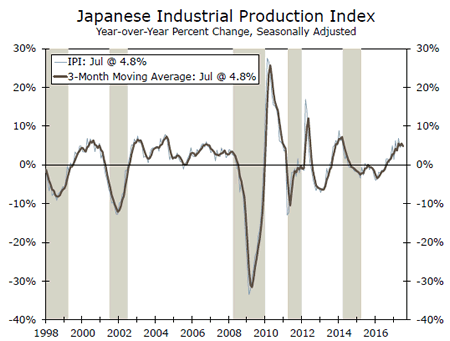
The Japanese economy has been in the news lately and it has not been for bad news, quite the opposite, as second quarter GDP growth quickened and analysts are starting to change their tone on the prospects for this troubled economy. Thus, on Thursday markets will be able to take a look at the industrial production index for August. The index has been very volatile on a month-overmonth basis, up one month and then down the following, but has remained relatively strong on a year-over-year basis, up 4.7 percent in July after a 5.5 percent increase in June. Thus, another strong year-over-year performance in August on both a year-over-year as well as on a monthly basis could reinforce the improved expectations regarding the Japanese economy. On that same day we will also get the release of retail sales which have also been relatively strong lately.
Previous: 4.7% Consensus: 5.2% (Year-Over-Year)
Point of View
Interest Rate Watch
Consumer Intentions: Future Expectations
This week the FOMC indicated their intentions for policy going forward. How do their intentions compare to our expectations? In this case, our outlook is for lower inflation and therefore a less aggressive path for the funds rate in 2018 relative to the FOMC’s dot plot. Additionally, we remain concerned that balance sheet normalization will represent further issues for long-term bond investors.
DOT Plot—Intentions
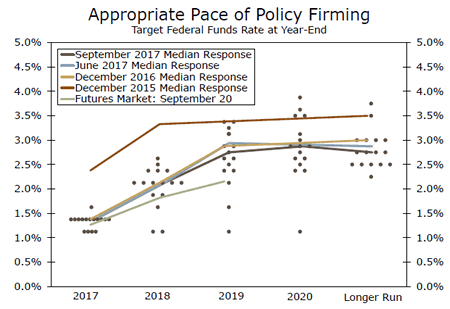
As illustrated in the top graph, the FOMC’s intentions signal continued increases in the federal funds rate throughout 2018/2019 and an eventual long-run equilibrium at 2.75 percent. In contrast, our view is that the FOMC will raise the funds rate in December, but only twice in 2018.
Future Expectations: Inflation
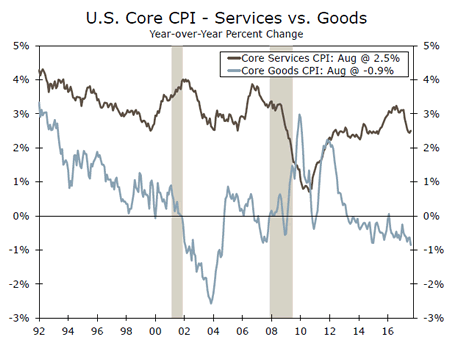
The recent pullback in inflation is again fanning fears about whether the Fed can reach its inflation target of 2 percent on a sustained basis. Goods prices have acted as a drag while lower commodity prices have also held down the index. Will an upswing in inflation come in time for the FOMC to raise rates once more in 2017?
Crossing the Rubicon or the Potomac
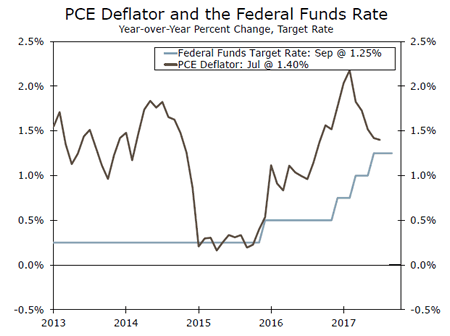
As illustrated in the bottom graph, the journey toward normalization for the funds rate is quickly approaching a critical crossing point. When the FOMC had earlier projected its path for the funds rate, the gap between the funds rate and the PCE rate of inflation was fairly wide. This gave the FOMC some latitude to pursue its intentions for the funds rate. However, the gap between the pace of inflation and the intended path of the funds rate has diminished significantly such that future increases in the funds rate will mean crossing into real interest rate territory.
In addition, our recent research on recession forecasting produced results that indicated that when the funds rate crosses over the low of the 10-year Treasury rate in the cycle then the probability of a recession within two years goes up significantly. This crossing has two critical market aspects. First, this signals to the market the seriousness of FOMC intentions to pursue future interest rates increases. Second, the rate increases puts earlier market purchases of bills/notes/bonds under pressure for potential reductions to their total returns.
Credit Market Insights
Record-breaking Household Wealth
This week, the Federal Reserve released the Financial Accounts of the United States for Q2-2017. The data revealed that household net worth increased for the seventh consecutive quarter and has now reached an all-time high of $96.2 trillion. This is a $1.7 trillion increase over the quarter, and much of this spike can be attributed to the bull market, as corporate equities jumped $1.1 trillion over the quarter and are up 19.4 percent over the year.
Growth of nonfinancial domestic debt slowed for the third consecutive quarter on a year-ago basis to 3.5 percent. Debt remains elevated, however, at 248 percent of real GDP. Domestic nonfinancial debt rose by an annual rate of 3.8 percent and this was driven primarily by government borrowing, as federal borrowing grew at a 3.6 percent pace, compared to a 2.6 percent contraction in Q1.
Consumer credit grew at an annual rate of 4.6 percent, with the highest yearly gains in auto loans and credit cards. Mortgage debt grew at a 2.8 percent annual rate, and mortgage debt as a percent of total assets continued decreasing, at just under 9 percent in Q2.
In all, the Q2 data looks to be encouraging, as households continue to break net worth records and the stock market and home values keep rising. Spending has not picked up at as strong a pace as wealth, but with record-breaking wealth figures, personal consumption could be due for an uptick.
Topic of the Week
Unwinding After a Long Decade
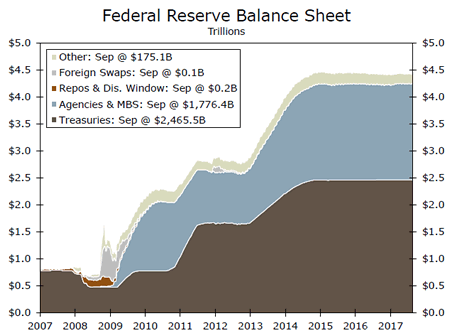
Nearly a decade ago, the Fed embarked on an ambitious and revolutionary program to buy financial assets in an effort to ease financial market conditions and spur an improvement in the economy. The multiple quantitative easing programs enacted in the subsequent years swelled the Fed’s balance sheet from less than $1 trillion in 2008 to more than $4 trillion today. At its meeting this past week, the FOMC formally announced its intent to begin winding down these asset holdings.
The balance sheet run-off will commence in October, with the Fed reinvesting the principal payments that exceed a modest cap of $10 billion per month ($6 billion for Treasuries and $4 billion for mortgage-backed securities). Then, every three months and assuming economic conditions still warrant it, the Fed will raise those caps by equal amounts four more times, until the final cap amount stands at $50 billion per month ($30 billion for Treasuries and $20 billion for MBS).
Encouragingly for Fed policymakers, a day that many pundits thought would never come was met with little fanfare by financial markets. Treasury yields rose after the announcement, but only modestly as the Fed’s intentions were telegraphed well in advance of the meeting. We do not expect Treasury yields to move meaningfully in the near-term, as the initial size of the caps are relatively modest. As the program ramps up, however, the rising supply should put upward pressure on yields, all else equal. With the announcement behind us, attention now turns to just how hawkish the FOMC will be with the fed funds rate as balance sheet reductions begin to accelerate. The terminal size of the balance sheet also remains an unresolved question.
Fed Chair Yellen is often seen in a dovish light, but she has helped lead four rate hikes after years at the zero bound and initiated balance sheet reductions. As the chapter on Chair Yellen’s term potentially comes to a close, a new chapter on the Fed’s unprecedented balance sheet unwind has begun.
