Week beginning 25 September 2017
- RBA on hold in 2017, 2018 and 2019.
- RBA: Deputy Governor Debelle and Assistant Governor Bullock speak.
- Australia: private sector credit.
- NZ: RBNZ policy decision, building consents, business confidence.
- China: national & Caixin PMIs.
- US: Fed chair Yellen speaks, PCE inflation, GDP 3rd estimate.
- Central banks: ECB’s Draghi, BOE’s Carney, BoC’s Poloz speak.
- Key economic & financial forecasts.
Information contained in this report was current as at 22 September 2017.
RBA on hold in 2017, 2018 and 2019
Markets have moved to price in three hikes for the RBA’s cash rate by end 2019. Other major banks concur broadly with that view.
Recall that in mid-August last year, these same players (markets and most other banks) were forecasting rate cuts over the course of the remainder of 2016 and 2017. Westpac’s view at that time was "rates on hold" in 2016 and 2017.
Readers of the Westpac Market Outlook publication for September will be aware that Westpac continues to forecast the cash rate to remain on hold out to mid-2019.
Indeed we are not convinced that the cash rate will need to rise any time throughout the course of 2017, 2018 or 2019.
This approach is clearly different to the thinking of the Reserve Bank Governor himself who expects to be tightening over that period (note his speech on "the next chapter" which was delivered yesterday).
However, we continue to point out that the RBA has a very different growth outlook for the Australian economy and Australia’s trading partners to our own.
The RBA expects growth in Australia to be 3.25% in 2018 and 3.5% in 2019 (above trend of 2.75%). Westpac expects a below trend pace of 2.5% in both years.
The RBA is also forecasting 2% underlying inflation in 2017 and 2018 (bottom of target band) to be followed by 2.5% in 2019. Underlying inflation is currently running at 1.8% (to June) and the upcoming revised weights are likely to reduce annual underlying inflation by 0.2-0.3%.
Going forward, the RBA’s inflation forecasts also look to be overly optimistic and are likely to be subject to downward revision. Recall that in 2016 when the RBA was forced to revise its inflation forecasts below 2% it believed it had little choice but to cut rates.
While the RBA does not provide detailed forecasts outside growth and inflation, comments from the RBA Governor and written reports point to a much more confident outlook for wages growth; incomes; employment; consumption; non-mining investment and the residential construction cycle.
The Reserve Bank expects wages growth to increase over the forecast period. A major puzzle for central banks globally has been the limited response of wages to stimulatory monetary policies since the GFC. Despite these policies in the US; Germany; the UK and Japan driving labour markets to near or full employment, wages have failed to respond. Explanations for this phenomenon have been structural: globalisation; technology; retiring higher paid baby boomers; low productivity growth; absence of pricing power for employers; low inflationary and wage expectations; high risk aversion following the GFC and job insecurity.
Consistent with that global theme, wages growth in Australia has also been weak. Australia’s wage price index has increased by 1.9% over the last year compared to average growth of 3.5%. The unemployment rate has held in the 5.5%-6.0% range compared to a generally accepted full employment rate in Australia of 5%.
Further, underemployment in Australia has been high at around 8.8% making total excess capacity around 14.5%. Given the global lessons on the structural wages outlook, it seems unlikely that wages in Australia (where spare capacity is higher than in these other developed economies) will lift significantly even in the medium term.
This weak wages performance has lowered annual real income growth to 0.6% while real consumption growth has held around 2.5%. The shortfall has been funded by a falling savings rate, particularly in the highly stressed mining states. Overall Australia’s household savings rate has fallen from 9% to 4.6% over the last three years.
Households will need to protect that fragile savings rate and pressures will emerge on consumer spending. Of course, other pressures are impacting households – rising energy prices; record high debt levels and political uncertainty. The latter effect will work through the business sector as businesses restrain employment and investment until political clarity is achieved following the 2019 election.
Markets may be underestimating the impact on the interest rate sensitive housing market of developments which are unfolding without official rate hikes.
The four majors (90% of the mortgage market) have been raising investor and interest only mortgage rates while applying tighter lending guidelines. House price inflation is slowing and regulators are unlikely to have any patience with a reversal of this trend.
To that point, six month annualised house price inflation (CoreLogic data) in Sydney has slowed from 22.4% in January to 4.8% in August. We observed a similar response to macroprudential policies in 2015/16 when six month annualised house price inflation slowed from 25% (July 2015) to -4.4% (April 2016).
Housing activity is also slowing despite a steady cash rate. Other factors, specifically relating to foreign investors, have turned the cycle. High rise building approvals have tumbled by 40% in the last year. This has been particularly due to investment restrictions in China; lending constraints by banks; and sharp increases in state government stamp duties for foreign investors. This downturn is likely to continue for at least a further two years.
While markets are currently captivated by expectations of a coordinated lift in global growth, we are more circumspect particularly around Australia’s trading partners.
With Chairman Xi likely to cement power following the National Congress in October, we expect that he will have little choice but to adopt policies to gradually deal with the excessive build up in corporate debt in China (now 166% of GDP), largely driven by the circa 30% compound growth rate of small and medium sized banks and non-banks over the last six years. These small banks now represent comparable asset bases to the heavily regulated policy banks which have only been growing at around 12% over the same period. It will be incumbent on the administration to arrest the growth rate of these small banks; off balance sheet vehicles; and non-bank institutions. Asset quality for these institutions must be suffering while reliance on overnight funding has lifted sharply.
Tighter credit conditions will slow China’s growth rate – we forecast a growth slowdown from 6.7% in 2017 to 6.2% in 2018.
Finally, the ongoing legacy of elevated risk aversion, which continues ten years after the Global Financial Crisis, is contributing to unusually steady interest rates around the world. Under our figuring, on the basis that this risk aversion persists for a few more years, a 40 month stretch of steady rates in Australia would not be out of place.
Bill Evans, Chief Economist
Data wrap
Aug Westpac-MI Leading Index
- The six month annualised growth rate in the Westpac- Melbourne Institute Leading Index, which indicates the likely pace of economic activity relative to trend three to nine months into the future, slipped from -0.04% in July to -0.19% in August.
- The growth rate remains negative for a third consecutive month pointing to below trend momentum and a sharp turnaround from strong positive, above trend reads at the start of the year.
- While the Index only gives us a glimpse of the likely momentum in the first few months of 2018 it currently seems to be more consistent with our view of the likely growth environment next year than the Reserve Bank’s forecast for growth comfortably above trend. Westpac is currently forecasting growth of 2.5% in 2018 compared to the RBA’s 3.25%. Trend growth is generally assessed as 2.75%.
- The Leading Index growth rate has slowed from 1.13% above trend in March to 0.19% below trend in August, a deterioration of 1.32ppts. Two components account for almost all of the reversal: commodity prices (-1.31ppts) and the yield spread (-0.43ppts). After surging nearly 40% over the second half of 2016, the RBA’s AUD commodity price index has retraced nearly 12% in 2017 to date. Similarly, after widening by over 100bps in 2016, the yield gap – the difference between the 90day bill rate and the 10yr bond rate – has narrowed by about 12bps, pointing to more subdued market outlook for economic conditions.
- The contribution from other index components has been more mixed. On the positive side, the index growth rate has been boosted by: dwelling approvals (+0.27ppts); aggregate monthly hours worked (+0.26ppts); and the Westpac-MI Unemployment Expectations index (+0.09ppts). However, these improvements have been partially offset by a bigger drag from the S&P/ASX 200 (-0.22ppts) while other components have been largely unchanged.
New Zealand: Week ahead & Data Wrap
New Zealand goes to the polls
New Zealand’s general election will be held on Saturday 23 September. It’s looking like a close race between the two major parties – the incumbent centre-right National party and the main centre-left opposition Labour party. And even after the votes are counted on Saturday night, it could be some time before we know the final make-up of the next government. Neither of the two major parties looks likely to win an outright majority of votes. As a result, they are both likely to need the support of at least one of the minor parties to form a government. Negotiating the necessary support agreements could take some time, potentially several weeks. On top of this, counting of special votes (such as those votes cast outside a voter’s usual electorate) could take another couple of weeks. We’ve seen in the past that this can have an important impact on the distribution of seats in Parliament, especially for the smaller parties. We’ll provide more colour on the outcome of the election next week.
A temporary pop higher in GDP growth…
Turning to economic developments, recently released GDP figures showed that economic activity expanded by 0.8% through the June quarter, to be up 2.7% over the past year. That was in line with our forecast, but slightly below the 0.9% rise that the Treasury and the Reserve Bank expected.
On the face of it, 0.8% isn’t a bad rate of expansion. But there are couple of things to keep in mind. Growth in the quarter was boosted by the recovery from earlier disruptions in the dairying and transport sectors. We also had a one-off boost to spending from very strong tourist inflows during the quarter related to some high profile sporting events. Against this backdrop, the pop higher in GDP growth through the June quarter actually looks fairly modest.
..but slowdown is underway…
Notably, with the above temporary boosts now abating, it looks like June will be the high point for GDP growth for a while. As we’ve been highlighting in recent weeks, momentum in economic activity has been fading. The slowdown in the housing market will likely dampen household spending over the coming months. In addition, growing headwinds in the construction sector are providing a brake on building activity. In fact, nationwide construction activity has fallen in both of the past two quarters, including softness in Auckland home building.
…with softening migration set to be a drag over the coming years
A further factor that leads us to expect softer GDP growth over the coming years is migration. For the past few years, record levels of net migration have seen population growth in New Zealand climbing to a little over 2% per annum. That’s a rapid pace for any developed economy, and some of the fastest population growth we’ve seen in New Zealand since the 1970s. The resulting increase in the size of the economy has masked what has actually been quite muted economic growth on a per capita basis in recent years. In fact, taking out population increases, GDP growth over the past year was only 0.6% on a per capita basis – a far cry from the headline figures.
The strength in net migration has been due to a couple of big trends. First is that for several years now, relatively few New Zealanders have been departing, and large numbers have been returning home, particularly from Australia. At the same time, we’ve seen a sharp rise in new arrivals from areas like China, India and the UK.
The above trends have resulted in a large and protracted migration cycle. However, we are now starting to see some changes. First, while we’re continuing to see firmness in new arrivals and the net outflow of New Zealanders remains low, these have both levelled off in recent months. At the same time, we’ve seen departures of non-New Zealand citizens steadily rising since mid-2016. In fact, departures of non-New Zealand citizens are nearly 20% higher than this time last year.
Many of the new arrivals to the country in recent years came over on temporary work and student visas, with numbers in these categories rising rapidly from around 2013. Typically those who come over on these programs stay for around three to four years. We’re now seeing the normal corresponding outflow, which we expect to continue over the coming months.
Our forecasts have long incorporated a slowdown in net migration. That slowdown may have been a little late in arriving, but now that is has, it looks like it could be coming through even faster than we had expected. This reinforces our expectations for softer GDP growth over the coming years.
Growth to under-perform the RBNZ’s forecasts, reinforcing the case for continued low interest rates
The above trends don’t mean the economy is heading for a crash. But a slowdown in growth is on the cards. And that will be a challenge for the Reserve Bank. In its August Monetary Policy Statement, the RBNZ forecast annual GDP growth to accelerate to 3.8%, from its current pace of 2.5%. And even then, it only expected inflation to be back around its 2% target mid-point by 2019. However, the kind of GDP acceleration the RBNZ is looking for appears increasingly out of reach, particularly as it relies partly on a strong pickup in construction, a sector that has been going backwards recently.
With this in mind, we expect that the RBNZ will keep the OCR on hold on at its next meeting (this coming Thursday), with the policy paragraph of the statement likely to remain largely unchanged from August.
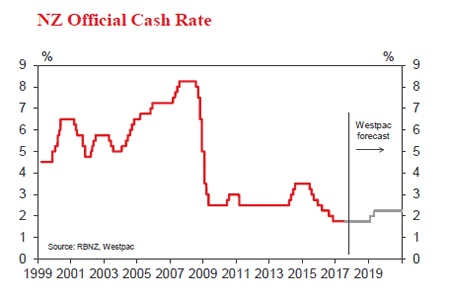
Interest rates will need to remain low for a long time in order to get inflation back up to 2% on a sustained basis. We expect the OCR to remain on hold until late 2019. In contrast, market pricing continues to suggest a hike by September next year.
Data previews
Aus Aug private credit
Sep 29, Last: 0.5%, WBC f/c: 0.4%
Mkt f/c: 0.5%, Range: 0.4% to 0.6%
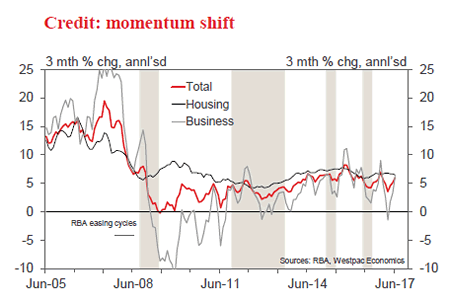
- Private credit is expected to expand by 0.4% in August to be 5.4% higher than a year ago. This follows a 0.46% gain in July and a 0.4% monthly average for the year to date. This reflects the balance of two countervailing forces at present.
- Housing credit is expected to increase by 0.5%, 6.5%yr. There is an emerging gradual slowing after a tightening of lending conditions. The 3 month annualised pace eases to 6.0%, down from 6.8% in March. Notably, the total value of housing finance grew by 15% in the year to January, but has stalled since.
- Business credit has emerged from a soft spot to record robust growth of late. We expect a gain of around 0.4%, bringing the 6 month annualised pace to 5.3%, while annual growth will be around 4.5%. Commercial finance has rebounded since February, up a trend 15%, and business investment has turned around from declines to modest gains.

NZ Aug business confidence
Sep 26, Last: 18.3
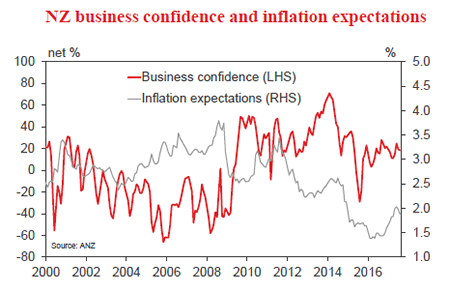
- Business confidence eased a bit in August, and we expect this to continue into September. With the General Election just around the corner, uncertainty is likely to weigh on businesses’ views of the economic outlook. In addition, the economy continues to face challenges regarding capacity constraints, especially in the construction sector. Nevertheless, the economy has been growing at a decent pace and confidence is expected to remain at firm levels.
- Inflation expectations dropped below 2% in the previous survey, in line with the most recent CPI outturn. We expect little change in the September survey.

NZ Reserve Bank Official Cash Rate Review
Sep 28, Last: 1.75%, WBC f/c: 1.75%, Mkt: 1.75%
- The RBNZ is highly unlikely to alter the stance of monetary policy next week, due to election uncertainty.
- Fortunately, the economic situation is such that the RBNZ can afford to sit on its hands.
- We expect no change in the OCR next week, and a repeat of previous monetary policy guidance.
- Beneath this placid surface, there is a lot going on with monetary policy.
- In time, we expect the RBNZ will have to reduce its GDP and house price forecasts, which will affect the stance of monetary policy.

NZ Aug building consents
Sep 29, Last: -0.7%, WBC f/c: flat
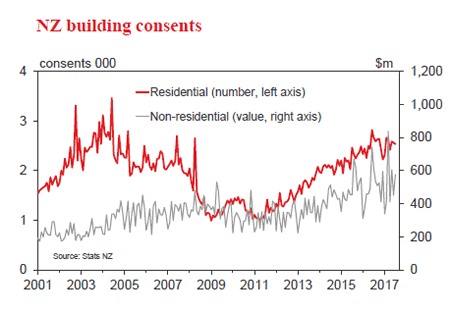
- Residential building consent issuance fell 0.7% in July, following a 1.3% decline in June. We expect that issuance will remain flat in August.
- Looking through recent volatility, consent issuance has lost momentum though mid-2017. In part this reflects the structural (but expected) downtrend in Canterbury, as post-earthquake reconstruction continues to gradually wind down. More notable, however, issuance in Auckland has failed to materially accelerate over the past year, and remains below the levels needed to keep up with population growth. Constraining the rise in building activity are capacity constraints, rising costs pressures and tighter credit conditions. Pre-election uncertainty may also be having some dampening impact. While we expect Auckland issuance to rise over time, it looks like this will occur gradually.

