The devastation caused by Hurricanes Harvey and Irma has raised questions over whether the near-term hit to the economy will keep the Fed from raising the fed funds rate once more this year. The biggest hurdle for the Fed squeezing in one more rate increase by year end, however, is inflation. The disruptions caused by storms even as large as Harvey and Irma are widely acknowledged to be short term for the national economy, with the hit to growth more than made up in subsequent quarters by rebuilding efforts. Whether the weakness in inflation since the start of the year can be as quickly reversed is less clear. In this note, we explore the factors that have contributed to the slowdown in inflation since the start of the year to determine if it is likely to be temporary or if below-target inflation is likely to persist.
Inflation Has Rolled Over
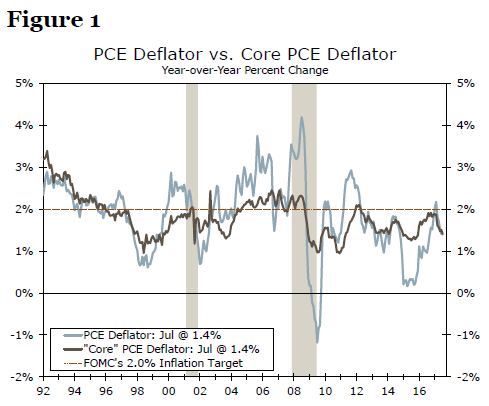
Headline and core personal consumption expenditures (PCE) inflation strengthened over the course of 2016 as the impact of lower oil prices and a rising dollar faded. Expectations, at least in the market, also improved late in the year following inflation’s pickup and optimism about more pro-growth policies out of Washington. In January, the PCE deflator hit 2.0 percent for the first time since 2012. Since then, however, inflation has rolled over (Figure 1). Not only has the headline measure been falling since February, but core PCE inflation hit its lowest level since 2015 in July. Whereas in 2015 Fed officials were able to point to the strengthening dollar and collapse in commodity prices as factors holding down inflation temporarily, the drivers of the recent slowdown have been more varied and therefore less easily labeled as transitory. The pullback is once again fanning fears about whether the Fed can reach its inflation target of 2 percent on a sustained basis.
Energy Whipsaws Headline Inflation Again
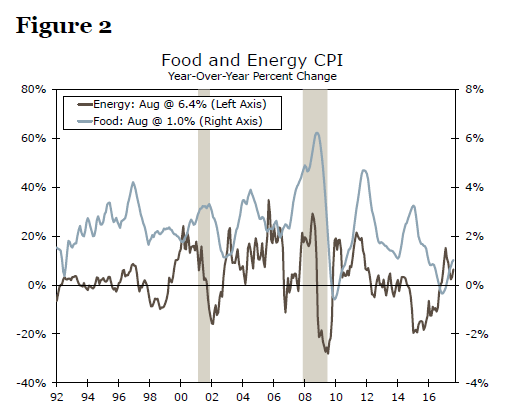
A 0.4 percent month-over-month rebound in the August consumer price index (CPI) hints that previous months’ softness may have been temporary, but a look across categories sheds light on whether the latest move is more noise or a signal. No categories are as noisy on a monthly basis as food and energy, which is why they are stripped out in calculating core inflation (Figure 2). While monthly changes fluctuate greatly and may not be indicative of the underlying direction of inflation, the trend in energy and food inflation remains important given that these components collectively comprise more than 20 percent of the consumption basket. Since price changes in food and energy are highly visible to consumers, they also play an outsized role in setting inflation expectations.
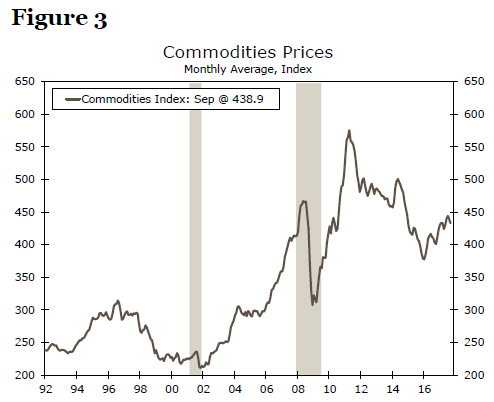
Commodities prices, most notably for crude oil but also for raw metals and agricultural crops, have suffered in the last three years as a result of supply increases and weak global demand (Figure 3). This marks a reversal in trend from the early years of the expansion, when prices rose substantially to reach peaks in mid-2011 and mid-2014. In fact, rising oil prices during the recession were a key reason why the United States did not see greater disinflation despite unemployment that reached 10 percent in 2009. This effect is largely because rising prices at the pump supported inflation expectations during this period (Figure 4).
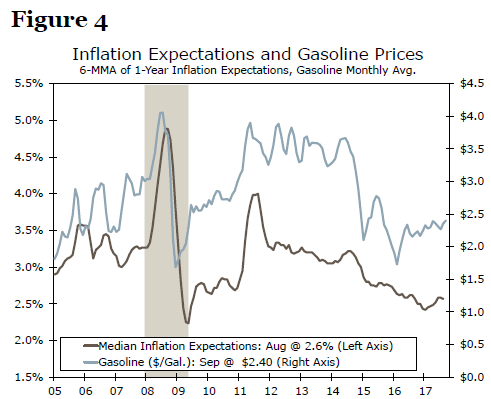
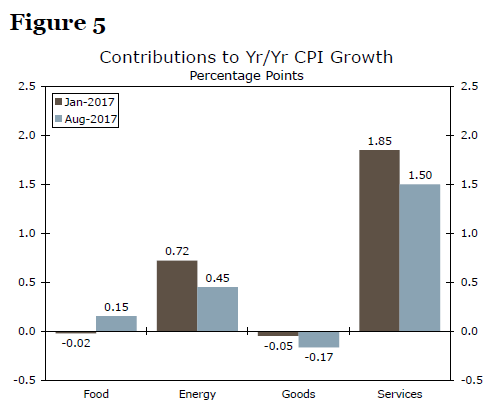
Recently, lower commodities prices may be having the opposite impact, holding down inflation both directly and through expectations. Whereas energy prices added 0.72 percentage points to year-over-year headline inflation in January, their 12-month contribution slipped to 0.45 percentage points in August. Gasoline prices are rising once again due to refinery outages and shortages caused by hurricanes Harvey and Irma, but we expect these effects to be shortlived. With oil prices expected to hover around $50 per barrel, little different than current levels, energy should have a relatively subdued effect on the inflation trend compared to historical standards in the coming months. Similarly, we expect food prices to remain relatively steady on the back of flatness in agricultural crop prices and increased competition in the grocery sector.
Core Weakness More Troublesome for the Fed
More concerning for Fed officials, core inflation has also slowed since the start of the year. After coming within a whisker of the FOMC’s target in January, the core PCE deflator has fallen back to 1.4 percent on a year-ago basis. Core CPI has slowed more dramatically, falling from 2.3 percent to 1.7 percent in August. A breakdown of core goods and core services shows that both have weakened since the start of the year and contributed to the moderation in inflation.
Goods prices have been a drag on the core index for the better part of the past four years. Soft inflation globally, a stronger dollar and technology have led to broad declines across components in recent years. Deflation in this sector has intensified, however, since the start of the year and has shaved an additional tenth of a percentage point off headline CPI since January (Figure 5). About half the slowdown in core goods inflation since the start of the year can be attributed to declining prices for new and used motor vehicles. Pressure on car prices may ease in the next few months due to replacement demand generated by the recent storms, but the lift is likely to be short term given that the number vehicles coming off-lease is expected to reach another record high in 2018. In contrast, the drag from apparel prices and other imported consumer goods is likely to ease as the dollar weakens further over the next year.
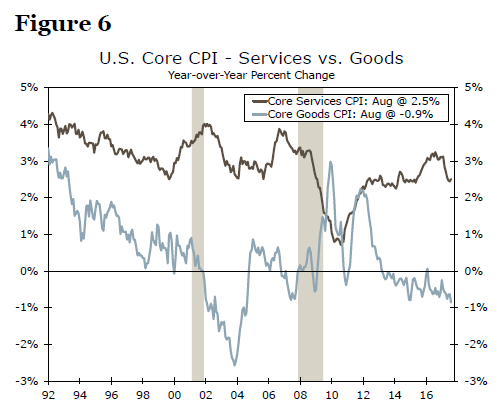
Core services, on the other hand, have been supportive of headline inflation, with prices consistently increasing at a rate above 2 percent (Figure 6). Since the start of the year, however, services inflation has declined markedly, from above 3 percent year-over-year for the 13 months ending in February to around 2.5 percent for the past four months. At 60 percent of the CPI, this has led to core services contributing 35 basis points less to headline inflation since January.
The slowdown within core services can be largely attributed to three components: cell phone services, medical care and housing (Figure 7). The declining cost of mobile phone services is the largest contributor to decelerating services inflation; prices for this component dropped every month this year on a year-ago basis, with the slowdown accelerating from January to August. The drop reflects both quality adjustments in how the BLS prices cell phone services and stiffer competition among providers that have reduced the price tag for unlimited data plans. Unless another similarly steep price war manifests, the most unfavorable readings will drop out of the 12-month change in inflation by March.
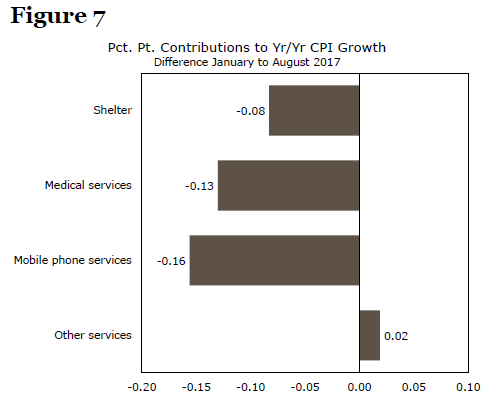
Medical care services have also contributed to the slowdown in headline inflation since the start of the year, adding 13 basis points less to the headline in August versus January. While some of the weakening can be traced to slower growth in the cost for health insurance, lower out-of-pocket costs for physician care has been a larger factor. The first outright decline in this component since data began in 1980 looks suspect to us, and indexes at this level should be interpreted cautiously given the sample size and response rate.
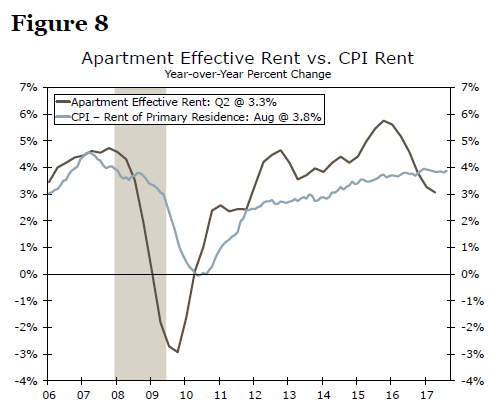
Whereas we suspect the hit to inflation from wireless and medical services will not be sustained, the slowdown in housing costs may be more persistent. Year-over-year shelter cost inflation ticked up in the August CPI reading compared to July, but growth remains below rates seen in the first quarter of this year. With housing costs at historic highs in many major metros, the limits of affordability will likely weigh on price growth going forward. Additionally, a deluge of rental units is beginning to put pressure on some industry measures of apartment rent, which tend to lead the rent component of CPI (Figure 8).
Recent Weakness Is Transitory But Expect Only a Modest Rebound
Despite having slowed since the start of the year, we expect inflation to resume its upward trend in the coming months. The pickup will be driven by multiple sources. After rising 25 percent from the middle of 2014 through the end of 2016 on a trade-weighted basis, the dollar is expected to weaken over the coming year as the Fed is no longer the only major central bank signaling less policy accommodation. The pullback should reduce pressure on core goods prices, as import prices of consumer goods closely track the value of the dollar (Figure 9). Similarly, the uptick in inflation globally suggests less disinflationary pressure from abroad.
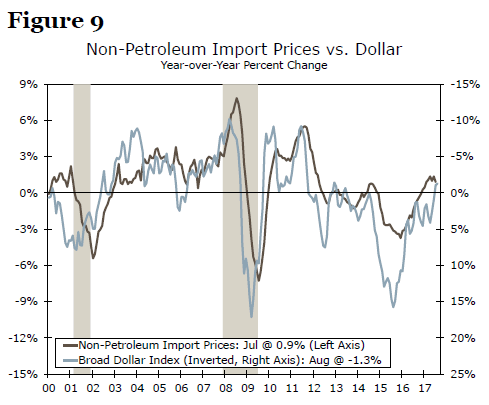
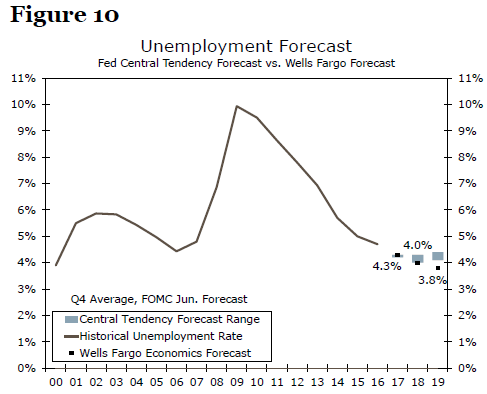
At only 19 percent of the CPI, however, the reduced pressure on core goods inflation will still be rather small. Therefore, a rebound in service costs will be needed to get inflation back on track. While the relationship between the labor market and inflation has weakened in recent years, it has not completely disappeared.2 Unemployment may tick up in the next couple of months following hurricane-related work disruptions, but the trend remains downward (Figure 10). We expect employment costs to edge up further with the labor market near full employment. Meanwhile, the recent declines in wireless and physician services look unsustainable.
That is not to say we expect a rapid reversal of the weakness earlier this year. The near-term bounce to energy prices from Hurricanes Harvey and Irma is likely to be short lived. Food price inflation is also expected to remain weak given recent commodity price movements and industry competition. Gains in core inflation should also be limited. Not only are prices for autos and housing hitting some resistance, but wage gains will remain hindered by sluggish productivity growth and low inflation expectations.
Temporary, But Fed Officials Will Need to See More
Slower inflation since the start of the year has been troubling in part due to its breadth. Not only has headline inflation weakened on another pullback in energy prices, but core inflation has also moderated. In contrast to the 2014-2015 bout of weakening related to oil prices and the value of the dollar, even core services inflation has slowed.
The rebound in August headline and core CPI has hinted at a pickup in the remaining months of the year. Hurricanes Harvey and Irma are also likely to boost inflation in the near term, most notably via energy prices, but also potentially through hotel and vehicle prices. While the lift from energy and autos may fade toward the end of the year and into 2018, other areas within core inflation should provide an offset as the dollar declines and labor costs edge higher.
Will an upswing in inflation come in time for the FOMC to raise rates once more before the end of the year? In June, the majority of committee’s members still expected to see one additional rate increase this year. Lower inflation readings over the summer will likely pare back September’s projections for core inflation at year end, which in turn could push out the appropriate timing for the Fed’s next rate hike. Coupled with the nascent runoff of the Fed’s balance sheet, more committee members are likely to display some hesitancy in supporting an additional rate hike. Yet there will be three more releases of PCE and CPI inflation data ahead of the FOMC’s December meeting. While this time-frame might not be long enough to boost the year-over-year readings of inflation, it should be enough to signal a shift in momentum. The trend in inflation remains tenuous, but we believe enough of the recent softness is transitory that we are not writing off one more rate hike in 2017 just yet.
