Gold closed the previous week in red territory but overall maintained its wider sideways motion it has been moving within for the past months. Gold traders continue to carefully monitor economic and geopolitical developments around the world, as they can prove key to identifying the market’s movements or trend. In this report, we aim to bring forth the most significant matters currently surrounding the gold market while providing at the same time a Gold price analysis from a technical perspective.
In the past week, the most significant economic event was the US jobs report for March, that provided from our point of view some positivity for the US economy. According to the official numbers released on the 1st of April, the US economy added 431,000 jobs in the month of March, and the unemployment rate dropped by 0.2% to reach 3.6%. Unemployment is currently running across pre-pandemic levels displaying strong job growth and continuous economic recovery. We must note that Gold was trading downwards from the start of the day and even though moved sideways after the release of the report, it eventually closed the day lower. Gold’s reaction to the news could imply that positive economic data tends to invite selling interest for the metal. Instead, positive economic data from the US may be favoring the USD index that was up on the specific day. Yet, confirmation that the Jobs market continues to tighten, and inflation is running at record high levels seems to encourage some FOMC members to support a double rate (0.50%) hike in the coming month. As the Gold market expects the Federal Reserve to increase rates moving forward, the markets could be in an adaptation period at the moment and may increase volatility substantially in the near future.
On a separate note, US Treasury yields continue to be on the rise possibly making the Gold market seem unattractive to traders. The non-yielding bullion may be forced to carry out muted price action as Treasury yields rise.
Furthermore, tensions with Russia’s war in Ukraine seem to be ongoing and nations are forced to close in with more sanctions. As the situation remains ongoing, we could not exclude the possibility of an unexpected movement on Gold prices if the situation is to escalate further. Moreover, another subject that could be important for the Gold market remains the fact that the Chinese Province of Shanghai has extended lockdown measures in the latest days. Lockdowns could impact Chinese factory output and possibly affect other international markets.
In the days ahead three economic events from the US stand out in our opinion and could create notable volatility for Gold prices. First on Wednesday the 6th of April, the FOMC Meeting Minutes could provide further information on the pace of future rate hikes which depending on the actual outcome can move the Gold market accordingly. On the 7th of March we get the Initial Jobless claims figure for the week. Yet the key event in the next seven days is the US inflation data for March to be released on the 12th of April. CPI rates have traditionally moved Gold prices as the metal’s volatile nature can be used as a hedge for higher prices. CPI rates can create intense volatility across the board upon release, thus caution is advised.
Technical Analysis
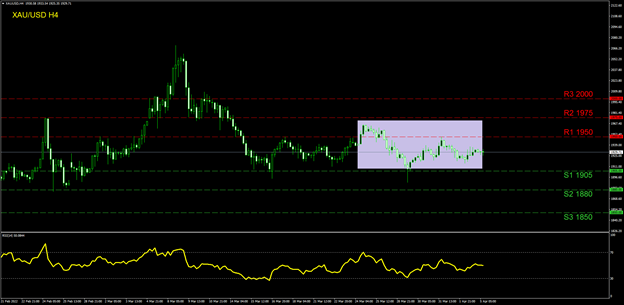
XAUUSD H4 chart
At the moment, Gold is trading between our (R1) 1950 resistance level and our (S1) 1905 support level. The (S1) has not been breached since late February proving it is a rather solid support line for traders to consider. The (R1) has been used as a resistance various times since March 15th and was breached only between the 24th and the 28th of March when the price action surged just below the (R2) 1975 resistance barrier but did not clearly test it. In general, the range between the (R2) 1975 resistance and the (S1) 1905 support is critical in our view, thus highlighted on our chart. If this range is breached to the upside, we could be seeing a formation of a solid buying trend. In the opposite direction if the breach is downwards, then it could signal a strong selling interest. In the scenario that buying orders are in excess we could see traders targeting the (R3) 2000 level which is our highest resistance level. In case of a selling trend extending into the following sessions we could see a test of the (S2) 1880 level initially and then the (S3) 1850 barrier coming into play. In our opinion, the precious metal continues to trade sideways and the RSI indicator below our chart seems to back this view, as it is currently moving across the 50-level.