Week beginning 7 August 2017
- RBA Statement on Monetary Policy – Upbeat Forecasts Despite Higher AUD.
- RBA: Governor Lowe and Assistant Governor of Financial Markets Kent speak.
- Australia: Westpac-MI Consumer Sentiment, housing finance, NAB business survey.
- NZ: RBNZ policy decision, inflation expectations, retail card spending, house sales.
- China: CPI, trade balance.
- US: CPI.
- Key economic & financial forecasts.
Information contained in this report was current as at 4 August 2017.
RBA Statement on Monetary Policy – Upbeat Forecasts Despite Higher AUD
The Reserve Bank has released its August Statement on Monetary Policy. These Statements are released on a quarterly basis with the last Statement printing in May this year. The most important aspects of the Statements are the Bank’s growth, inflation and unemployment forecasts.
The forecasts are predicated on two key assumptions. Firstly that the exchange rate will remain unchanged from the current spot level throughout the forecast period (out to December 2019), and secondly that interest rates will broadly follow market pricing.
In May, the AUD was assessed at USD 0.74 and TWI 64. For the August forecasts, it appears that an Australian dollar of USD 0.80 and TWI 67 has been chosen. In May, markets only gave a slight probability to any rate movements in 2018 whereas today markets have priced in one rate hike of 0.25% by end 2018.
In summary, financial conditions in August have tightened markedly relative to May. Surprisingly however, the Bank has not lowered its above trend growth forecasts for 2018 and 2019. These remain at 2¾ – 3¾ per cent (mid-point 3¼ per cent) in 2018 and are 3 – 4 per cent (mid-point 3½ per cent) in the year to December 2019. The period for the forecasts has been extended from mid- 2019 to end 2019. In May, growth to June 2019 was forecast at 3¼ per cent and this has now been raised to 3½ per cent.
There has been a reduction in the growth forecast for 2017 from 3 per cent (mid-point) to 2½ per cent. That largely reflects a lower than expected first quarter growth rate of 0.3% compared to the Bank’s likely estimate at the time of the May Statement of 0.6%. We estimate that in May, the assumption was that for the last three quarters of 2017, growth would average around 0.8% per quarter. This now appears to have been slightly lowered and taking into account the lower starting point, explains the reduced growth forecast in 2017. We are a little surprised by this given we expect that in the second half of 2017, there will be a catch up effect from the weather related slowdown in Q1, giving our own estimate for 2017 of 2.8% growth.
However from a policy perspective, the more important growth forecasts are now 2018 and 2019. Westpac expects growth in both those years of around 2.5%, slightly below trend of 2.75%, and well below the above trend forecasts of 3¼ and 3½ per cent respectively, we see in today’s SoMP.
Key differences between our own view and the RBA’s view are firstly that wages growth will remain anchored containing income growth and complimented by a shock to household budgets from rising energy costs; consumer spending growth will remain around 2.6%. The Bank is clearly expecting stronger consumption growth than our forecast and that has other spill over implications.
Of most importance will be the ongoing slow growth in nonmining business investment which we expect to be contained to around 2%, well below where the Bank appears to be pitching their forecasts. We certainly have sympathy with the Bank’s observation that "a recovery in non-mining investment has been forecast for some time and, given the subdued signals from leading indicators, (it is possible) that a substantial pick up is still some way off".
We are also expecting a more substantial drag from residential dwelling construction of around -0.3% compared to the Bank’s assessment that the growth impact in 2018 and 2019 of slowing housing will be broadly neutral.
From our perspective, a fall in housing construction; subdued consumer spending and a drag on services exports from the high Australian Dollar will constrain employment growth through 2018. The Bank sees things differently, expecting recently strong employment growth to persist into 2018, with the unemployment rate expected to fall to 5.4% by the end of 2019 compared to our current forecast that the unemployment rate will in fact be rising through 2018, reaching 6% by year’s end.
Two other domestic factors are important, firstly the Bank is of the view that "wage growth is expected to pick up gradually over the next few years". That is despite convincing evidence offshore, that countries with full employment, and in the case of the US, an unemployment rate considerably below the full employment rate, are not experiencing wage pressures. This different assessment of household income growth is one of the key explanations behind our more downbeat view of the economic outlook. Secondly, we expect that the wealth effect from sharply rising house prices in NSW and Victoria is about to reverse. There is no argument that household debt levels are elevated. The prospect of very limited further increases of house prices in those markets may start to dampen consumer spending in particular by discouraging households to further subsidise consumption growth by lowering their saving rates.
The rise in the Australian dollar poses some near term challenges to the forecasts. The Bank even obliges by setting out their own modelling results of the impact of the appreciation of the trade weighted exchange rate on inflation and growth. It quotes that "a 10 per cent appreciation (if not associated with rising commodity prices) would be expected to lower year-ended inflation by around ½ a percentage point over each of the following two years. Output would be expected to be lower by ½ to 1 per cent in around 2 years’ time effectively taking ¼ to a ½ per cent off growth rates in each of those two years". With the TWI already having appreciated by 5 per cent, and the Bank not changing its growth forecasts, it appears that other factors particularly around government spending and a general more encouraging environment justifies the forecasts. Of course it is also likely that with the Bank expecting a fall in commodity prices and further interest rate increases from the US Federal Reserve, there may be some subjective adjustments to the model based forecasts.
As discussed there is no change to the Bank’s underlying inflation forecasts remaining at 1½ to 2½ per cent in both 2017 and 2018 to be followed by 2½ per cent in 2019. That is despite the guidance from the modelling indicating that were the 5 per cent appreciation to be sustained, then those numbers would have to be adjusted down by ½ a per cent in both 2018 and 2019.
The modelling does qualify the results by noting that the results only hold if the appreciation is not associated with higher commodity prices. However, to the extent that commodity prices have risen recently, the Bank explicitly points out that mining companies have not recycled their increased prosperity back into the economy through investment and employment but rather payed down debt, increased dividends or increased share buybacks.
There is one area of discussion where we do concur with the Bank’s views. We do expect that the Chinese authorities will continue to gradually tighten financial conditions although we are not expecting the style of credit induced sharp slowdown we saw in 2015.
Conclusion for Policy
From a policy perspective, the Bank’s forecasts of growth lifting to well above trend in 2018 and 2019, and inflation returning to the middle of the target band in 2019 would imply that it is expecting to be raising rates probably in the second half of 2018.
However, the Bank has the luxury to delay any rate decisions until it can clearly test whether its forecast dynamics around higher consumer spending growth, a solid lift in investment spending, rising wages growth, benign housing developments and falling unemployment (along with what we suspect a falling AUD) come to pass.
As discussed, we are much less confident about that scenario and therefore expect rates to remain on hold next year.
Bill Evans, Chief Economist
Data wrap
Jun dwelling approvals
- Dwelling approvals were much stronger than expected in the June month, rebounding 10.9% from a 5.4% drop in May. Westpac and the consensus forecast was for a 1% gain.
- Our view was based on high rise approvals levelling out after a sharp pull-back over the previous 12mths (the second half of 2016 in particular) with some strength showing through in non-high rise components, the latter reflecting a recent lift in construction related finance approvals. Instead high rise approvals rebounded strongly month to month – still more likely to be noise than a renewed uptrend – but non high rise segments also posted a strong gain.
- Private sector detached house approvals rose 3.4% in the month, to be up nearly 2%qtr over Q2 as a whole. High rise approvals look to have jumped about 14% but were still down for Q2 as a whole and about 20% below year ago levels. Interestingly, ‘mid rise’ unit approvals surged 30% in the month – this small segment tends to be more stable than high rise but may be finding more favour with developers in part due to changes in state government planning policies.
- By state, the high rise jump was concentrated in NSW. The lift in non-high rise approvals was broadly-based, NSW up 11%, Qld up 9% and Vic up 5%.
- The value of renovation approvals rose 6.7%, building on a 13.9% rebound in May from a 14.7% drop in April. Looking through the volatility, renovation approvals look to be back on a moderate but not particularly convincing uptrend. Notably, recent gains have been across all major states.
- The value of non res building approvals dipped 2.6% in the month but is still up firmly on a year ago (trend approvals up 12.7%yr). The lift continues to come across a range of subsegments including offices, retail, hotels & recreation, and education.
- Overall, while the headline surge is clearly flattered by month to month noise in the high rise segment, the gains in non-high rise approvals look more ‘genuine’. That should provide a little more counter-weight to the high rise construction boom wind down that is expected to dominate activity from late this year although it remains to be seen how enduring the strength in ‘non high rise’ segments in recent months will prove to be.
June private credit
- Credit grew by 0.6% in June, up from gains of 0.4% in each of the three previous months. As is often the case, a shift in the business segment – on this occasion a spike – is the source of monthly volatility in total credit.
- Annual total credit growth lifted to 5.4%, up from 5.0% in May. In part this is due to base effects, with the weak June 2016 result dropping out of the calculations. Total credit grew by only 0.2% in June 2016 as uncertainty ahead of the July 2 Federal election saw business credit contract, down 0.4%.
- Annual credit growth of 5.4% represents a moderation from 6.2% in mid-2016. Over this period, business growth has slowed to 4.4% from 6.5%, reflecting both a loss of appetite from borrowers and lenders. Housing credit growth of 6.6% currently rounds down from 6.7% a year earlier.
- Housing credit growth is set to slow in response to the recent tightening of lending standards and out of cycle interest rate increases by the commercial banks. As well, the impacts of the RBA’s rate cuts in May and August 2016 have passed. More generous state government first home buyer initiatives, taking effect from 1 July, will provide a partial offset.
- There is tentative evidence that housing credit is beginning to slow. In June, housing credit expanded by 0.50%. This represents a step-down from a 0.55% average pace in the March quarter. It follows outcomes of 0.51% in April and a surprise 0.56% rise in May, which was most likely noise.
- On a quarterly base, the tentative slowdown in housing credit is evident. The recent quarterly growth profile is: 6.0% annualised in Q2 2016; lifting to 6.5% in Q3; 6.7% in Q4; and 6.8% in 2017 Q1; then moderating to 6.5% in Q2; and printing at 6.2% annualised for the month of June 2017.
- Note that the total value of housing finance has trended a little lower of late, declining by 1.5% over the four months to May. While some month to month volatility is likely, we expect this emerging downtrend to continue.
- As to investor housing credit, this grew by 0.41%mth in June, the softest monthly result since May 2016 – partly due to switching to the owner-occupier market. Annual growth is 7.4% currently, while the 3 month annualised pace is 6.0%.
- Turning to business, lending has been volatile around a weaker trend over the past year or so. There was the dampening impact from heightened uncertainty around the Federal election. This was followed by a burst of lending late in 2016 around infrastructure privatisation, contributing to a 1.1% jump in business credit in the month of December.
- In the business segment of late, there has been an underlying loss of appetite from some borrowers (including deleveraging by the mining sector) and from some lenders (partly to reduce exposures to selected industries and larger companies).
- Business credit growth of 0.9% in the month of June exceeds that suggested by recent trends in commercial finance (see chart overleaf), possibly reflecting the impact of a sizeable transaction. Commercial finance while up from the lows of early 2017 is not particularly strong.
- Business investment in the real economy by the non-mining sectors is advancing, but growth is currently relatively subdued, pointing to only modest growth in business credit (see chart overleaf).
Jun & Q2 retail trade
- The June retail report came in above expectations both for the month and Q2. Sales rose a further 0.3% in June, extending the strong rebound in Apr-May from a weather affected contraction in Feb-Mar.
- The market was looking for a more moderate 0.2% gain. Annual sales growth has now lifted back to 3.8%yr, the strongest pace since Apr 2016 although some of this momentum will clearly fade as weather effects drop out of the picture.
- For Q2 as a whole, real retail sales, i.e. ‘volumes’ rose 1.5% as the weather effects rebound coincided with aggressive price discounting. The quarterly gain was the strongest since June 2009 when aggressive fiscal and monetary stimulus were giving a major boost to household cash flows.
- The quarter saw nominal sales up 1.4% and retail prices dip 0.1%, including a 0.1% dip for food that was a surprise given weather events also disrupted fresh fruit and vegetable supplies. Annual growth lifted to 2.5%yr.
- The detail points to fairly broad based strength. While food retail was flat in June and department stores recorded a 0.3% decline other storetypes recorded solid gains (total retail ex basic food up 0.5%mth, +3.3%yr).
- The Q2 gain was even broader with all storetypes except cafes & restaurants recording gains over 1%qtr.
- It’s a similar story with the state breakdown with all states except Vic recording gains in the June month and all states except WA recording 1%+ gains.
- Overall this is a significant upside surprise. Although the retail survey is a partial measure that does not always ‘map’ to the quarterly consumption figures in the national accounts, the jump from a flat Q1 to strong Q2 is a clear positive signal.
- Vehicle sales also posted another solid rise in Q2. Private sector business surveys also indicate conditions in ‘consumer service’ sectors have remained more buoyant than for retail throughout the first half of the year.
- Overall this points to upside risk to our current 0.8%qtr forecast for Q2 consumption, with an increase closer to 1% now looking more likely
Jun trade balance
- Australian exports and Australia’s trade balance have been buffeted by weather disruptions of late, particularly the fury of Cyclone Debbie.
- In June, Australia’s trade surplus narrowed to $856mn, falling short of expectations (mkt median $1.8bn and Westpac $1.4bn).
- The surplus for May was downgraded, lowered to $2.0bn from $2.5bn. April was also revised, sliding from a small surplus of $90mn to a small deficit of $76mn.
- Imports for June were stronger than anticipated, increasing by 2.4% (+$730mn). We anticipated a small fall, -0.7% (-$200mn), led lower by weaker fuel prices. Fuel did fall, down $463mn. However, strength was evident across capital goods, consumption items, and gold.
- Exports declined in June, but not as sharply as expected. Exports fell by 1.4%, -$439mn vs a forecast -4.0%, -$1.3bn.
- Export weakness in June was evident in metal ores and coal, on weaker prices and volumes, broadly as anticipated. The upside surprises were in the volatile gold segment and fuels proved to be more resilient than anticipated.
- For the June quarter, the trade surplus narrowed to $2.8bn from $7.5bn for the March quarter. This reflected the impact of falling commodity prices. Total export prices fell by an estimated 4.5% in the quarter and the terms of trade declined by around 5%.
- Real net exports had a broadly neutral impact on growth in the June quarter, on our initial calculations, largely meeting our expectations, a forecast of +0.1ppts.
New Zealand: Week ahead & Data Wrap
This week Stats NZ gave us the lowdown on New Zealand’s labour market. The most striking aspect of the data was a 0.2% drop in employment, as measured by the Household Labour Force Survey. But we are not reading anything into that – it is probably survey volatility rather than the start of a new trend. The alternative Quarterly Employment Survey (which surveys employers) registered FTE employment growth of 0.7%, and we have observed no anecdotes or other data pointing to a sudden shift away from the long-established trend of robust employment growth.
Looking more broadly at the data, New Zealand’s labour market story is much as it has been for a couple of years now. Jobs are certainly being created at a rapid pace, but that is only just enough to keep up with rapid population growth. Consequently, the unemployment rate is falling only gradually – it is now 4.8%, compared to 5.1% a year ago.
At these levels, unemployment is still too high to put significant pressure on employers, so wage growth remains slow. The labour cost index has registered just 1.6% wage growth over the past year – wage growth has been stuck at that slow pace since 2013.
From here we do expect the unemployment rate to fall further, but only slowly and not by enough to generate the sort of rapid wage growth we experienced in the mid-2000s. Our forecasts have the unemployment rate reaching a low point of 4.5% later this year, before rising again late in the decade as the economy digests the inevitable slowdown in earthquake-related construction work and a slower housing market.
Occasionally one hears suggestions that if only we dialled back on migration, then the resident population would have more of a shot at the available jobs and the unemployment rate would come down faster. That is known as the "lump of labour" fallacy – it wrongly assumes that the number of jobs available is fixed. In reality, New Zealand’s rapid rate of population growth at present is itself generating demand in the economy, and is therefore responsible for some of the employment growth. If the rate of net migration were to slow sharply, it is unclear whether the unemployment rate would rise (via job losses in construction, for example) or fall.
The devil is in the detail when it comes to assessing the impact of rapid population growth on the labour market. We suspect that the composition of net migration at present is affecting the distribution of income growth in New Zealand. More bodies on the ground means more sales for businesses such as retailers and construction firms. But the preponderance of low-wage workers in the current mix of net migration may well be negatively impacting low-skill wage rates in New Zealand.
The other key development this week was Fonterra’s announcement that it has upgraded its forecast of the farmgate milk price for the current season to $6.75. Demand conditions around the world are certainly positive at present, but we are wary of European and US farmers lifting production in response to high prices. We are also conscious that there is scope for New Zealand’s milk production season to outstrip forecasts. With the possibility of extra supply hitting the market, we prefer to stick with our forecast of a $6.50 milk price.
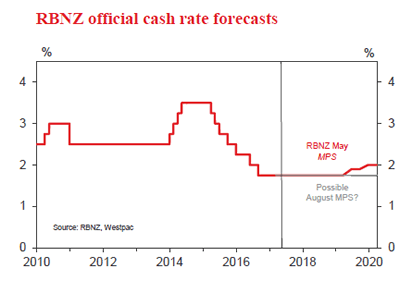
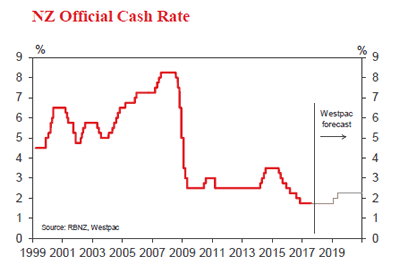
Next week we expect the Reserve Bank will surprise markets with a dovish Monetary Policy Statement. Financial market pricing currently suggests that the OCR will begin rising from mid-2018, but the RBNZ has been sharply at odds with that view. The RBNZ sees the OCR as "on hold for the foreseeable future", and is on the record saying it is equally likely that the next move in the OCR could be up or down.
Over the past few months there has been a run of soft data in New Zealand, including GDP, inflation, the housing market and building consents. At the same time, the exchange rate has risen to levels that the RBNZ will be finding uncomfortable.
That said, we do not expect the Reserve Bank to make a big splash. The data has been soft, but the situation does not warrant the RBNZ altering its bottom-line guidance. We would expect the final sentence of the press release to be a virtual repeat of the past four: "Monetary policy will remain accommodative for a considerable period. Numerous uncertainties remain and policy may need to adjust accordingly."
But the RBNZ could still strike a dovish tone by issuing a completely flat OCR forecast (the previous incarnation featured a gradual drift higher in the OCR from 2019). The RBNZ might also sum the situation up with a catch-all phrase along the lines of: "Developments since the May Monetary Policy Statement have on balance softened the outlook for medium term inflation."
And finally, the RBNZ will almost certainly lambast the high exchange rate, possibly going so far as to say that if the exchange rate fails to fall, the outlook for monetary policy will need to be reassessed.
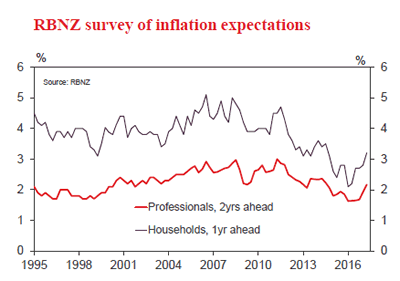
The other key piece of data to watch out for next week is the RBNZ’s survey of inflation expectations. This popped higher last quarter, but is expected to pull back this quarter. A surprise on expectations in either direction could well influence the RBNZ’s MPS later in the week.
Data previews
Aus Aug Westpac-MI Consumer Sentiment
Aug 9, Last: 96.6
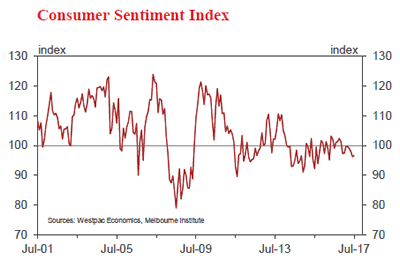
- The Westpac-Melbourne Institute Consumer Sentiment Index rose 0.4% from 96.2 in June to 96.6 in July. Despite the lift, sentiment has tended to drift lower in 2017, the survey detail pointing to renewed pressures on finances.
- The Aug survey is in the field over the week to Aug 6. Developments over the last month look mostly positive for sentiment including: the RBA’s decision to leave rates unchanged at its Aug meeting, the Governor also sending a clear signal that rate rises were unlikely any time soon; a terrorist bomb plot allegedly foiled in Sydney; a strong rally in the AUD (up near 4¢ US vs the July survey); a further modest recovery in the ASX (up 0.7% since July but still below its April highs); another solid 1.6% rise in dwelling prices; a continued improvement in labour market conditions and lower petrol prices.
Aus Jun housing finance (no.)
Aug 9, Last: 1.0%, WBC f/c: 1.5%
Mkt f/c: 1.5%, Range: 0.5% to 3.0%
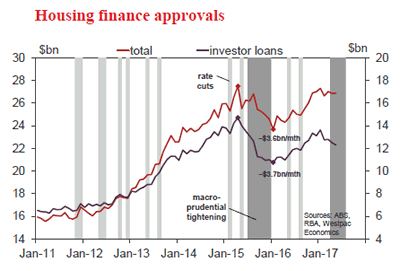
- The number of owner occupier loans rose 1% in May to be down 3.5%yr. This was the second monthly observation since APRA’s macro prudential tightening in late March and associated increases in rates for investor and ‘interest only’ loans. Some of the rise in owner occupier loans is likely due to switching between investor and owner occupier products. A lift in refinancing suggests we may also be seeing existing borrowers move from interest only to standard loans. Notably both the value of investor loans and the total value of loans also held up a bit better than expected (down 1.4% and up 0.1% respectively).
- For June, industry data points to another lift in owner occupier loans, which we expect to be up 1.5%mth. Note that a second round of mortgage rate increases for ‘interest only’ loans came through late in the month.
NZ Jul house prices and sales
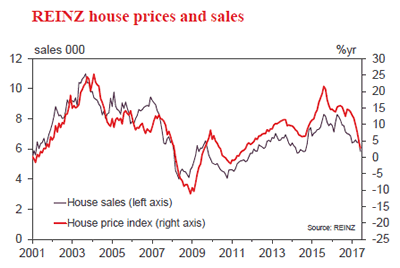
Aug 7-11 (tbc), Sales last: -9.9%, Prices last: 2.8%yr
- The housing market has continued to cool this year, as mortgage rates have risen and loan-to-value ratio restrictions have held back investors. Uncertainty about housing and tax policy after next month’s election may also be suppressing activity.
- House prices are now down slightly on year-ago levels in Auckland and Christchurch, and further declines seem likely. Elsewhere, prices have continued to rise, but the pace is slowing in most regions.
- House sales have fallen by 25% over the last year. Industry figures suggest that this was followed by a sharp drop in new listings in July – property owners don’t sell into a falling market if they don’t have to.
NZ Q3 survey of inflation expectations
Aug 7, Two years ahead, last: 2.17%, Westpac f/c: 2.0%
- The Reserve Bank’s survey of inflation expectations has attracted a great deal of market attention recently, having played a key role in the RBNZ’s decision to cut the OCR last year. Now the tables have turned: expectations of inflation two years ahead rose to 2.2% in the latest quarter, back above the 2% target midpoint for the first time since 2014.
- However, the RBNZ has been eager to point out that it doesn’t respond to the survey mechanically, and recent RBNZ research suggests that expectations have become more backward-looking. That’s probably even more true now that the survey is held immediately after the CPI release; the drop in the actual inflation rate from 2.2% to 1.7% in Q2 will have been front of mind for respondents this time.
- Consequently, we think that inflation expectations will also pull back this quarter, to something like 2% (which was also our submission to the survey).
NZ RBNZ Monetary Policy Statement
Aug 10, last: 1.75%, Westpac f/c: 1.75%, Mkt f/c: 1.75%
- We expect the RBNZ will leave the OCR at 1.75% and reiterate that monetary policy is on hold for the foreseeable future.
- The press release will probably emphasise the softer tone to recent data, and the RBNZ’s discomfort with the high exchange rate.
- The RBNZ may expunge any hint of hikes from its OCR forecast, and issue slightly more dovish guidance in the press release.
- An MPS along these lines would surprise financial markets, possibly causing swap rates and the exchange rate to fall on the day.
NZ Jun retail card spending
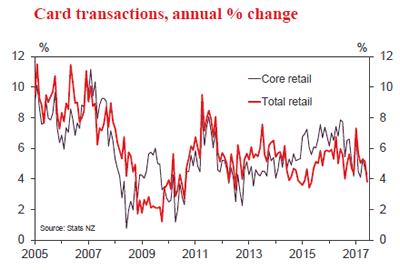
Aug 10, Last: flat, Westpac f/c: +0.1%
- Overall retail spending was flat in June. However, the headline result was strongly influenced by sharp falls in petrol prices over the month. Spending in core categories was actually up 0.8%, underpinned by a solid 2.4% gain in hospitality spending on the back of the Lions tour and related strength in tourism.
- We’re forecasting a subdued 0.1% gain in total spending in July. In part, this reflects continued declines in fuel prices that have weighing on nominal spending. Core spending is expected to have risen by a modest 0.3% over the month. While interest rates are still low, they have been pushing upwards. In addition, the slowdown in the housing market will dampen spending in a number of areas.
US Jul CPI
Aug 11, Last: 0.0%, WBC 0.1%
- Growing doubts over the US inflation pulse has materially reduced market expectations of further policy action by the FOMC. Heralding the start of the second half of 2017, the July CPI report will be a critical outcome for the market.
- Recently we highlighted that the vast majority of the deceleration in annual inflation, from 2.8%yr in February to 1.6%yr in June, had been due to transitory factors – most notably weak energy prices and an unusually large decline in the price of wireless telephone services. Abstracting from these two factors, annual core inflation at June was 2.1%yr. There is therefore little reason to be concerned that disinflation will become entrenched.
- That said, strong inflation is also unlikely anytime soon as wage growth remains modest. We look for a 0.1% rise in headline prices; excluding food and energy, a 0.2% gain is expected.

