Week beginning 17 July 2017
- Views on RBA and AUD.
- RBA: meeting minutes, speeches from Heath, Debelle and Bullock.
- Australia: employment, Westpac-MI Leading Index.
- NZ: CPI.
- Japan: BoJ policy decision.
- China: GDP.
- Euro Area: ECB policy decision.
- US: housing starts, building permits.
- Key economic & financial forecasts.
Views on RBA and AUD
Despite some market speculation, the Governor issued a Statement, following the July 4 Board meeting, which did not contain any hint of a tightening bias. Despite that action, markets have again moved to price in a rate hike of 25 basis points by August next year.
This action by the market seems to be in response to firming expectations of policy tightening in overseas markets complemented by the recent buoyant Employment Reports. We have not changed our view that rates will remain on hold throughout the remainder of 2017 and 2018.
That view is predicated around a number of key forecasts. Firstly, we expect that growth in Australia will slow materially through 2018. Our current forecast of 2.5% growth is in contrast with the Reserve Bank’s current forecast of 3.25% growth in 2018 – an expected lift in the growth momentum from 2017. That 3.25% is around 0.5% above the assessed trend growth rate and is, arguably, consistent with the market’s expectation of a rate hike in 2018. Of course that does not mean that the RBA is committed to a rate hike in 2018. The Bank regularly emphasises the uncertainties around growth forecasts. It has the flexibility to assess the incoming data to determine whether it is consistent with its current growth expectations.
There are a number of reasons behind our cautious approach to growth next year. Firstly, it seems clear from the dwelling approval data that the housing construction cycle has peaked. We expect that, through 2018, housing construction will be a negative influence on growth subtracting around 0.25% from growth compared to a contribution of 0.3% in 2016.
As we saw in the July Consumer Sentiment Report, the consumer remains downbeat. Tepid wages growth is the key behind this cautious mood of the consumer. As we are seeing in other countries such as US; UK; Germany; Japan and New Zealand, even full employment has not been able to boost wages growth in these countries. With ample spare capacity set to remain in the Australian labour market, our prospects for the recovery in wages growth that has been projected in official circles seem remote. Consequently we expect a below trend contribution to growth in 2018 from consumer spending.
Dwelling construction and consumer spending are key drivers of jobs growth. With both those factors underwhelming, we expect spare capacity in the labour market to persist with the unemployment rate edging back to 6% in 2018. Ongoing soft wages growth coupled with further pressures on retail margins are likely to maintain a frustrating undershoot for inflation with the risk that the Bank’s preferred inflation measures remain below the 2% threshold.
Businesses have been cautious investors through this whole cycle. A downturn in domestic sales growth as consumers and housing activity slow is hardly likely to reboot business investment in 2018.
Finally, the RBA is likely to feel a lot more comfortable about asset markets through 2018. We expect house price inflation to largely disappear over the course of the next year or so – just as we experienced in 2015/2016. That adjustment in 2015/16 was engineered by rising interest rates, which were initiated by the banks in response to tighter official lending guidelines and increased capital requirement. The banks also tightened lending policies.
In that 2015/2016 period the banks raised mortgage rates by an average of 27 basis points. So far in this cycle rates are up by an average of 28 basis points although the mix is different. More pressure has been put on to interest only loans (nearly 40% of banks’ mortgage books) with no increases on owner occupied principal and interest loans (compared to 17 basis points in 2015). As in 2015 banks are also implementing tighter lending policies. It appears that regulators are determined to slow lending particularly for investors (investor interest only loan rates are up by 76 basis points in the recent months) while commercial property loans are likely to receive attention.
From an interest rate perspective these conditions we envisage for 2018 would, under other circumstances, look conducive to even lower rates. Indeed I would have to say that if rates do move next year it is more likely to be down than up. However, the experience of the rate cuts in May and August 2016 will not be forgotten by Governor Lowe. As discussed we saw house price inflation come under control by mid-2016 under the weight of the macro prudential tightening. That effect largely dissipated in the wake of those rate cuts. House price inflation returned quickly through the second half of 2016 while the objective of those cuts – to restore underlying inflation to the 2 – 3% band – was not achieved. That experience, under Lowe’s predecessor will be vividly recalled.
One development which we expect over the course of 2018 which support growth prospects for 2019 is a sharp fall in the Australian dollar.
We expect the AUD to fall back to USD 0.65 by end 2018.
We are not particularly surprised that AUD is currently around USD 0.77.
Recognition of a significantly weaker profile for the AUD is not expected to gather momentum until the first half of 2018.
Factors that we consider will change sentiment in the AUD from current market positioning are the following:
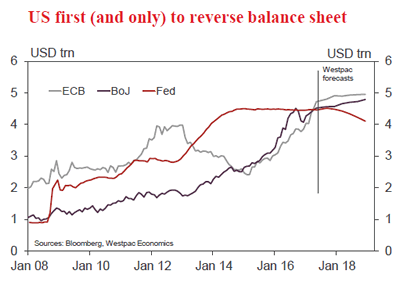
- US interest rates are expected to rise much more quickly than current market expectations. We envisage a US rate hike by September or certainly December with two more hikes in 2018. Market pricing currently anticipates only a 50% probability of a hike by year’s end and only one further hike in 2018. While Chair Yellen noted that rates were nearing her assessment of neutral she also emphasised that she expected the neutral rate to rise over the course of the next two years or so. Overall, we expect a further 0.75% increase in the Federal funds rate over the next two years compared to market expectations of around 0.40%.
- There has also been an "overshoot" in negativity around the US and the USD in the face of disappointment in Trump’s progress toward heath care; tax; infrastructure; and regulatory reform. Despite three rate hikes in December; March; and June the USD Index (DXY) has actually fallen by 2% since prior to the US election in November. DXY is actually down 7% since its peak in December last year as markets have lost confidence in prospects for reform in the US. Markets now seem vulnerable to some upside surprises.
- While there is no way of assessing markets’ direct expectations for growth in Australia the fact that a 0.25% rate hike is now factored in by August next year implies that markets are expecting a much stronger growth environment in Australia than our view (see above). We continue to expect rates to remain on hold through 2018.
- Consequently our expectation for the short term yield differential between Australia and the US by end 2018 is minus 0.40% compared to market expectations of plus 0.20%. We consider that, based on historical evidence, Australian rates falling below US rates will have an exponential impact on confidence in the AUD.
- Consider the only previous examples of AUD short rates falling below US rates. Over the year from July 1997 when the AUD cash rate fell 0.5% below the Federal funds rate the AUD tumbled from USD 0.75 to USD 0.57. In August 1999 when AUD also fell back to 0.5% below US rates the AUD fell from USD 0.67 to USD 0.58.
- To be sure, the AUD will remain at higher levels in the next expected episode of negative interest rate differentials due to a much more supportive level for commodity prices. However we do envisage a considerable fall in the key commodity prices through 2018. Through 2018 we expect a 26% fall in the bulk commodity Index, including a 30% fall in the iron ore price. That adjustment will be underpinned by a marked slowdown in Chinese industrial demand, as the government resumes its rebalancing policies. We also expect a lift in Australian and Brazilian production of iron ore. Because these producers have much lower cost curves than other marginal producers who prosper when demand is booming prices can fall back towards the cost curves of the highly efficient Australian and Brazilian producers. Industry reports estimate current cost curves of around USD 20 per ton in both Australia and Brazil. Our end target level of USD 40 per tonne will still be an attractive proposition for these low cost producers.
In summary our expectation that US rates and policy will surprise to the upside while Australian growth and rates will surprise to the downside coupled with a slowdown in China and weaker commodity prices still supports our outlook for the Australian dollar in 2018.
Data wrap
May housing finance approvals
- The May housing finance data was largely in line with expectations. The number of owner occupier loans rose 1% vs market expectations of 1.5% (Westpac +1%). The value of investor loans declined 1.4% but were still up 8.8%yr.
- Note that the this is the second monthly observation since APRA’s macro prudential tightening announced in late March and associated increases in increase rates with larger rises for investor and ‘interest only’ loans.
- Some of the rise in owner occupier loans in May is likely due to switching between investor and owner occupier loan products. A lift in refinancing suggests we may also be seeing existing borrowers move from interest only to standard loans. Total new owner occupier loans ex refi were down 0.1% in the month.
- Due to these compositional effects, our main focus is on the value of investor loans and total value of loans. These both look to have held up a bit better than expected in May with a mild 1.4% dip in the value of investor loan approvals and total ex refi flat at +0.1%.
- The detail around owner-occupier approvals showed another strong rise for construction finance approvals (+2.4%mth, 6.2%yr) with annual growth running at the strongest pace since 2014. That in turn suggests non high rise dwelling construction may be lifting a touch. Finance for purchase of newly built dwellings – which includes for settlement of ‘off the plan’ purchases, rose 3.7% to be up 8.6%yr.
- The total number of owner occupier approvals (ex refi) by state showed small gains in NSW and Vic more than offset small declines across the other major states.
- Overall, the May approvals update tells us little about the extent of the slowdown following the macro-prudential tightening. Other, timelier indicators such as auction activity and price growth show a material slowdown coming through although both remain fairly mild to date (for price growth in particular). Even this largely pre-dates the impact of a second round of mortgage interest rate increase in June. It also predates increased assistance for first home buyers introduced by state governments in NSW, Vic and Qld from July. While finance approvals will provide more guidance in coming months the full picture of how these factors are resolving is unlikely to emerge until much later in the year.
Jun NAB busines survey
- The NAB business survey reported that business conditions strengthened in June, led higher by the construction and manufacturing sectors, while confidence edge higher.
- The survey was conducted from June 26 to 30.
- In June, the conditions index rose 4pts to 15, more than reversing the 3pt decline spread over the previous two months. This is well above the long-run average for this series, of +1 (dating from 1989), but below the highs of 2007 ahead of the GFC.
- The components of business conditions for June were: trading conditions up 6pts to +21; profitability up 5pts to +15; and employment conditions held onto earlier gains, steady at +7.
- Business confidence moved higher, edging up 1pt to +9. Confidence has improved since 2016 and is at above average levels, although it continues to trail conditions.
- How to interpret the survey? The elevated level of the business conditions index is overstating actual conditions across the broader economy, as it has tended to do since the GFC (see chart overleaf).
- Directionally, the survey suggests that the Australian economy is experiencing a trend improvement in underlying conditions after the slowdown in mid-2016, which was associated with the July Federal election.
- The official data was mixed early in 2017, impacted by weather disruptions. More recently, partial indicators have improved (retail sales, exports, jobs), lending support to our view that the economy will rebound in 2017 from these temporary disruptions, although be constrained by lacklustre consumer spending at a time of weak wages growth.
- On employment growth, the previously weak official data has fallen into line with the positive signal from the private business surveys, meeting our expectations. This highlights the value of the private business surveys.
- The ABS reports that a hiring burst over the three months March to May has lifted annual employment growth to 2.0%, up from 0.9% in December. This brings actual employment growth into line with the NAB employment conditions index (see chart opposite). The survey suggests that the recent trend improvement in employment will be sustained in coming months.
- By industry, a trend improvement in business conditions is evident in mining (supported by higher commodity prices); construction (as the mining investment drag reduces and with a boost from public works and commercial building); manufacturing (benefitting from construction, mining, agriculture and the lower AUD); as well as wholesale and transport & utilities. Conditions in finance, business & property have cooled, as lending conditions for housing have tightened. As to the consumer sectors, recreational & personal has moderated, while the previously very weak retail sectors has recovered somewhat.
- By state, business conditions for June are positive in all six states. Trend conditions are most favourable in the major nonmining state of NSW and Victoria. The improvement in overall conditions between 2016H2 and 2017H1 is largely driven by the mining states of WA and Qld, as well as SA.
Jul Westpac-MI Consumer Sentiment
- The Westpac Melbourne Institute Index of Consumer Sentiment rose by 0.4% in July from 96.2 in June to 96.6 in July.
- This is the eighth consecutive month where the Index has printed below 100 indicating that pessimists continue to outnumber optimists. The Index is not sending encouraging signals about the outlook for consumer spending.
- Having said that, developments around interest rates during the month could have been much more damaging for confidence than turned out to be the case. Banks increased rates on ‘interest only’ mortgages while there was considerable media speculation about prospects for rising rates overall.
- In the event confidence amongst respondents with mortgages actually rose by 4.8%. However, the interest rate increases may have contributed to softer reads in some sub-groups with higher exposure to investor housing – sentiment down about 10% in the month for those aged over 55.
- The key components of the Index gauging respondents’ assessments of their own financial position were mixed. The component measuring assessments for family finances relative to a year ago lifted slightly by 1.2% while the component tracking assessments of the outlook for finances over the next 12 months fell by 4.2%.
- Overall however both of these components are down significantly over the year by around 4%. While-ever respondents remain concerned about their own finances prospects for a marked lift in spending patterns will remain remote.
- On the other hand there was an improvement in how respondents assess conditions in the labour market. The Westpac Melbourne Institute Index of Unemployment Expectations fell by 3.1% (a lower number indicates that fewer consumers expect unemployment to rise) but really only recouped the increase we saw in the last month. Over the last year this Index has remained fairly steady despite the encouraging developments in the stunning employment reports which indicate that 141,000 jobs were added in the three months to May.
- Other components of the Index were also mixed. The ‘economic conditions over the next 12 months’ sub-index increased by 1.8% while the ‘economic conditions over the next five years’ sub-index fell by 1.5%. Over the last year, 12 month prospects have increased by a modest 1.1% while 5 year prospects have fallen by 8%.
- The ‘time to buy a major household item’ sub-index improved by 4.2% to be up 1.0% over the year.
- Conditions in the housing market appear to be stabilising, at least for the time being. The ‘time to buy a dwelling’ index lifted by 3.1% in the month – the first significant increase we have seen for this year. Recall that in the first half of 2017 this indicator fell consistently by just over 10%. Recent increases in state government assistance for first home buyers appears to have been a big factor in the July rise with the ‘time to buy a dwelling’ sub-index for 25 – 34 year olds surging 36% in the month.
- The outlook for house prices also partially reversed the recent deterioration. The Westpac Melbourne Institute Index of House Price Expectations increased by 8.6% following the cumulative 11.8% fall we saw in the previous two months. With banks raising some mortgage rates and overall confidence soft it is too early to call a recovery in confidence in the housing market.
New Zealand: week ahead & data wrap
The RBNZ continues to face a number of challenges …
Over the past week, we have seen updates on several key aspects of the economic outlook. Putting these together, we’re continuing to see an environment where inflation pressures remain very well contained.
… with inflation set to soften in the near term …
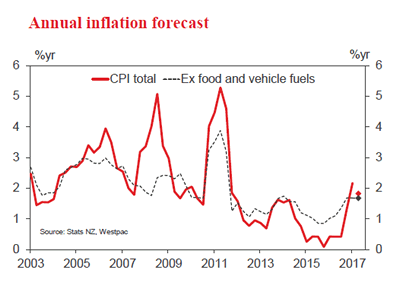
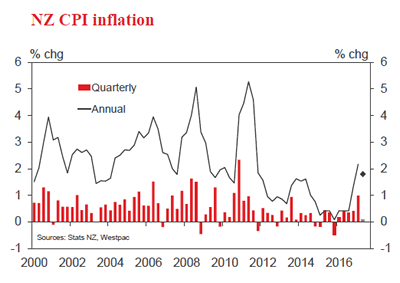
First up, inflation is looking like it will come in on the softer side of the RBNZ’s expectations. We expect a subdued 0.1% rise in the CPI for the June quarter, which would see annual inflation recede from 2.2% to 1.8%. New Zealand’s inflation figures are often thrown around by temporary factors, and so far this year has been no different. There was an unusually large 1% rise in prices over the March quarter, led by gains in food and fuel prices. Those two items will also play an important role in the June quarter figures, though this time their net impact on the inflation rate will be negative.
Our forecast is lower than the 0.3% quarterly increase that the Reserve Bank forecast in its May Monetary Policy Statement. However, a downside surprise on inflation is unlikely to be too much of a concern for the Reserve Bank, which had already concluded that the recent pickup was temporary and that inflation would be well below 2% again by next year.
Taking out food and fuel prices gives us a clearer picture of where inflation is heading. On this metric, inflation bottomed out some time in 2015 and has risen gradually since then, though it remains below the 2% midpoint of the Reserve Bank’s target band. This is consistent with our view that while the economy is growing at a solid pace, it’s not at risk of overheating.
… housing market conditions weakening …
Next up, we are seeing increasing signs of softness coming through in the housing market. The past year has seen, house price inflation slow sharply and a large decline in house sales. These developments have come on the back of a tightening in lending conditions and the creep higher in mortgage rates. Initially the impact of these changes had been concentrated heavily in Auckland. However, the latest REINZ housing market report indicates that other regions are now slowing materially. Notably, sales throughout the country have fallen sharply through mid- 2017, and by much more than the usual winter lull. In addition, Auckland prices have continued to fall and are now down 4% since January, while much of the earlier resilience in house prices in other regions has also faded.
The slowdown in the housing market has important implications for the New Zealand economy, with housing market conditions being a key driver of household spending. Indeed, already through the earlier part of this year, the spending on durables have been relatively flat. With mortgage rates to continue to push higher, and house prices to continue easing, this signals an important headwind for economic activity over the year ahead.
… and the NZD grinding upwards.
Lastly, the New Zealand dollar has continued to push higher against the greenback, and on a trade-weighted basis, is around 3% higher than what the RBNZ was expecting. As well as adding to the challenges for exporters, lingering strength in the NZD/USD will continue to dampen imported inflation. Indeed, the strong rise in the New Zealand dollar over 2016 has still not yet fully been reflected in the prices of imported goods such as clothing, cars, electronics and home furnishings.
OCR to remain on hold for some time.
Putting this all together, it is looking very unlikely that inflation will threaten the upper-limit of the RBNZ’s target band anytime soon. This reinforces our expectation that the RBNZ will keep the Official Cash Rate on hold through 2017 and 2018. This presents a challenge to financial markets, which in our view are too eager to assume that the RBNZ will soon join the club of central banks that are contemplating interest rate hikes. Markets are pricing in an OCR hike by June next year.
Data previews
Aus Jun Westpac – MI Leading Index
Jul 19, Last: 0.62%
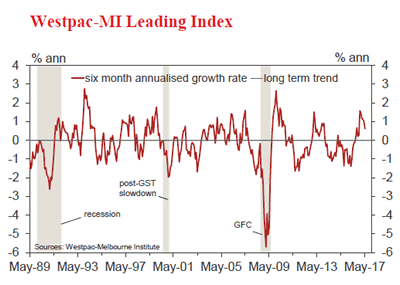
- The six month annualised growth rate in the Leading Index, a guide to the pace of economic activity three to nine months into the future, eased from 1.01% in April to 0.62% in May. The index is pointing to a clear slowing in momentum but remains comfortably above trend. The easing mainly reflects a less supportive backdrop for commodity prices and in global financial markets.
- The June read looks likely to be another weak one with more soft updates on a range of components including: the Westpac-MI Consumer Expectations Index ( – 1.4% vs – 3.2% last month); and commodity prices ( – 5.3% vs – 4.8%); dwelling approvals ( – 5.6% vs +4.8%). The yield spread has also narrowed ( – 12.5bps vs a 1.8bps widening last month). More imporantly the the six month rate is now cycling past the big lift in commodity prices in late 2016.
Aus June Labour Force employment ‘000
Jul 20, Last: 42.0k, WBC f/c: 20k
Mkt f/c: 15k, Range: -12k to 30k
- In May total employment rose 42.0k compared to a market’s forecast for 10k.
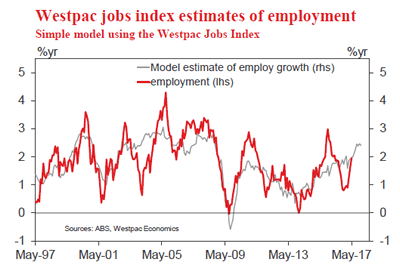
- The Australian labour market went through a soft patch in 2016, particularly from August to November, but as we moved through 2017 there has been a distinct uplift in employment. In the last three months the annual pace lifted from 0.9%yr in Feb to 2.0%yr in May. Compare this to the 106k gain, or 0.9%yr, in the year to Feb. In May the 42k gain in employment resulted in a 141.1k gain over the last three months or an average of 47k per month.
- Westpac’s Jobs Index currently suggests employment growth should be around 2.0%yr before accelerating to 2½%yr by November. Our forecast for a 20k gain in June holds the annual rate at 2.0%yr.
Aus May Labour Force – unemployment %
Jul 20, Last: 5.5% WBC f/c: 5.6%
Mkt f/c: 5.6%, Range: 5.5% to 5.7%
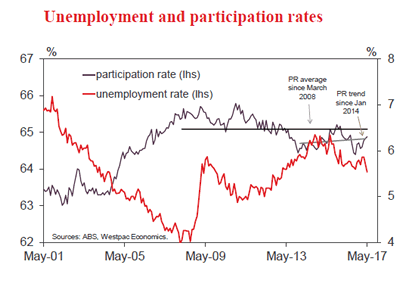
- The solid May gain in total employment was associated with a 0.1ppt lift in participation, to 64.9, driving a 23.4k gain in the labour force. This rise in the labour force limited the fall in the unemployment rate to 5.5% from 5.6% – at two decimal places the unemployment rate was 5.53%. We had been looking for the unemployment rate to fall over the next few months but we had not expected it to get to 5.5% so soon.
- The rise in participation in the month was all with females. Male participation was flat at 70.5 while female participation lifted to 59.4 from 59.3. And more surprising was that just about all of the gain in participation can be attributed to the rise in female participation in NSW, from 57.3 to 58.1.
- Holding participation flat in May lifts the labour force by 25k seeing the unemployment rate rounding up to 5.6%.
NZ Q2 CPI
Jul 18, Last: 1.0%, Westpac f/c: 0.1%, Mkt f/c: 0.2%
- We expect a 0.1% rise in the Consumer Price Index for the June quarter. This would bring the annual inflation rate down from 2.2% to 1.8%.
- A well-publicised spike in vegetable prices has been offset by a fall in fuel prices. We expect other seasonal influences to be a slight negative on balance.
- Our forecast is below the Reserve Bank’s estimate of a 0.3% quarterly rise. However, the Reserve Bank was already expecting the recent pickup in inflation to recede over the coming year. We expect the OCR to remain unchanged until 2019, in contrast to market expectations of a rate hike by mid-2018.
China Q2 GDP
Jul 17, Last: 6.9%, WBC 6.8%
- The March quarter followed December’s beat with a second consecutive upside surprise, annual real GDP growth accelerating from 6.8%yr to 6.9%yr against expectations for an unchanged result.
- Compared to authorities’ 2017 annual growth target of "around 6.5%yr", Q1 was certainly a strong start which provides a solid foundation to meet (or exceed) the 2017 growth target of 6.5%.
- Available PMI data for the June quarter points to continued robust growth over the past three months. Though the deterioration in employment conditions does warrant some caution over momentum in the services sector.
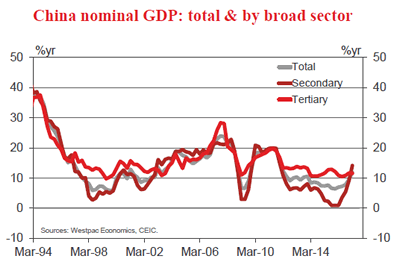
- We look for annual growth to edge down to 6.8% in Q2 on its way to a 6.6% result for 2017 overall. Nominal growth will continue to be supported by commodity prices.
ECB July meeting
Jul 20, Last: -0.4%, WBC -0.4%
- The market has continued to speculate over a near-term change in the stance of policy by the ECB in recent months. Optimsim in the region is unquestionably strong and this has supported robust gains in the Euro.
- The reality is that no announcement is likely until at least September, when the ECB’s next set of forecasts will be released. The actual stance of policy wont change until the beginning of next year. During 2018, the pace of asset purchases will be curtailed, but only slowly.
- In terms of the key themes, the focus for post-meeting communications will be on: underutilisation of labour and associated weak wages growth; consequent expectations for core inflation; and the balance of activity growth between consumption and investment.
