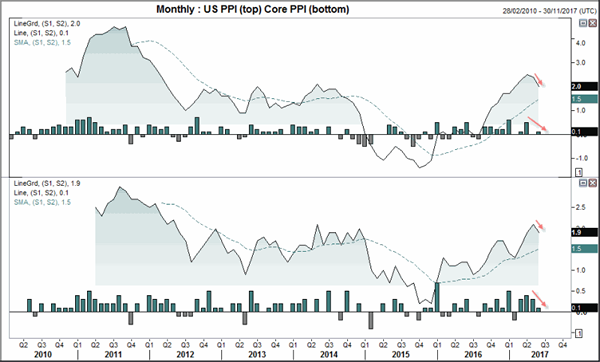
The softness on PPI data overnight sugests a top has been seen, which doesn;t bode well for CPI data or Fed tightening in H2.
Producer prices softened in June, with the broad PPI read falling to 2% YoY from 2.4% in May, although slightly above expectations of 1.9%. Core PPI disappointed by missing exactions of 2% and falling from 2.1% in May to 1.9% in June. As the monthly reads for both have declined since April the we can expect further softness in July unless we are treated to a spike higher. We don’t see this as a likely occurrence when we consider that both reads have edged lower from prior levels of resistance and our assessment of commodity prices. This is an important point which we’ll cover in greater detail shortly, especially as inflation data is out tonight for the US.

Yellen appeared before the Senate again last night, in what could be her last testimony if Trump replaces her next year. The sentiment surrounding the economy was mostly a repeat of the prior session, of a cautiously optimistic view and talk of slight balance sheet reduction. However, about President Trump’s 3% growth target Lady Yellen deemed it to be ‘quite challenging’. Acknowledging it would be a wonderful target to achieve she went on to say it would require a broad set of changes form tax reforms and improved education. With all the controversy surrounding the Whitehouse and failure to reform the health care system, tax reforms currently look dead in the water so perhaps ‘challenging’ would be an understatement.

If we assess annual GDP from 1948 we can see the long-term trend points lower and that the long-term average is 3.2%. At 2.1% we are at the lower bound of the top half of the average to -1 standard deviation, which is another sign of weakness. When these long-term stats are working against you it likely requires even more effort to overpower them, let alone sustain growth on average at such a pace. As this is clearly a secular trend we doubt the abilities of any single president or government to turn this one around. So with growth more likely to trend lower than reverse the secular trend, we take a look at the other issue for the Fed; inflation.

The next chart provides a huge problem for the Fed and partially explains why traders remain sanguine about the Fed’s hiking trajectory. The CRB commodity index is a key ingredient for inflation and remains within a secular downtrend. Perhaps the low was seen in Feb 2016, but we would have to see a break above 200 before seriously considering it. By taking the YoY% rate of commode prices we can easily see the close relationship between prices paid by manufacturer’s (taken from the ISM report) and, interestingly, Core PCE inflation. The latter excludes volatile items such as commodities yet the relationship remains clear. If commodity prices are rising then this puts upwards pressure through the supply chain to the consumer and, conversely, they fall in tandem too. With commodity prices currently down -3.1% over the past 12 months and considering the time it takes for the declines deflationary effect to impact inflation, then it is more than likely inflation will remain pressured over the next few months or even the remainder of the year.
