Wall Street stocks tanked yesterday after the U.S and the U.K yield curve inverted. A yield curve is simply the spread between the longer-term bond yields and the shorter ones. Historically, a yield curve inversion has been accompanied by a recession. Investors are currently being worried about the weakness of the global growth. Yesterday, data showed that the German economy shrank in the second quarter of the year. In China, fixed asset investment, industrial production, manufacturing production, and retail sales declined in July.
The Australian dollar rose in the Asian session after the statistics office released the employment data for the month of July. The numbers showed that the unemployment rate remained unchanged at 5.2%. The employment change increased by 41.1k, which was much higher than the consensus estimates of 14k. The participation rate increased slightly to 66.1% from the previous 66%. These numbers show that the Australian economy is doing well, at a time when global risks are high.
Later today, the market will receive important data from Europe and the United States. In the U.K,the Office of National Statistics (ONS) will release the retail sales data for July. Investors expect the data to show that the retail sales eased by – 0.2% after rising by 0.9% in the previous month. On an annualized rate, the sales are expected to decline from the previous 3.8% to 2.6‰. In the U.S, the retail sales are expected to decline slightly from 0.4% to 0.3‰. The Philadelphia manufacturing index for August is expected to decline to 10 from the previous 21.8.
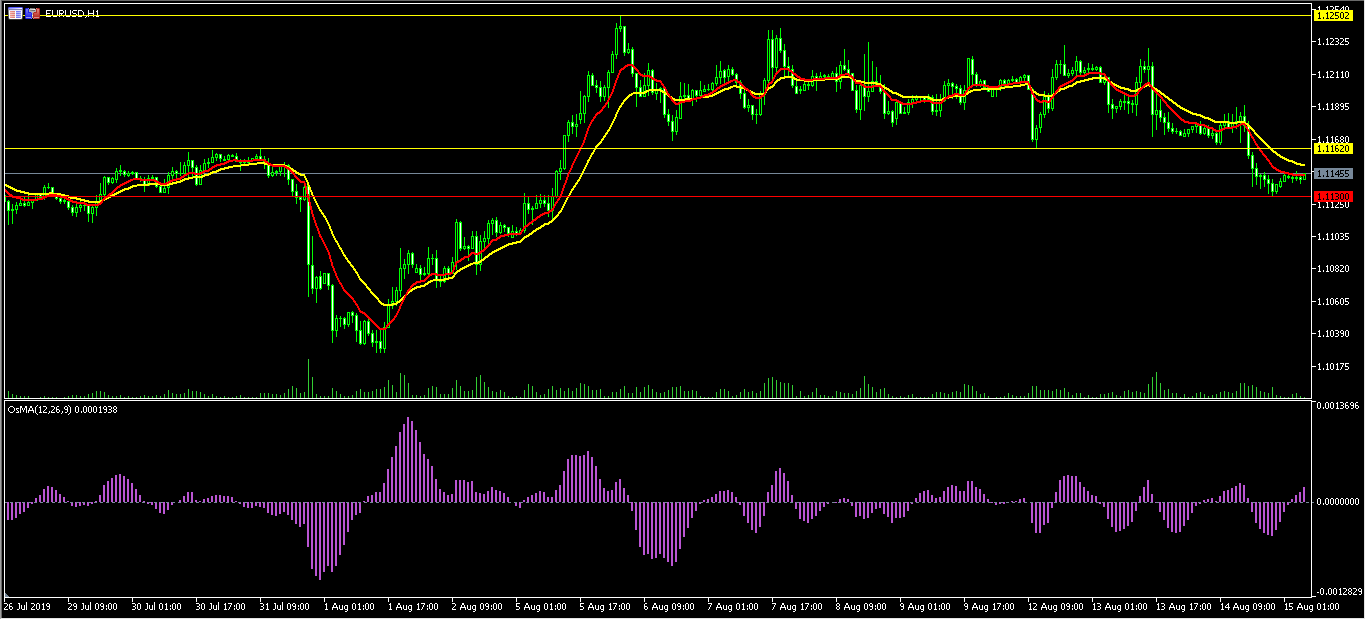
EUR/USD
Yesterday, the EUR/USD pair declined sharply to a low of 1.1130. This was below the important channel that the pair has been in the past few days. In the Asian session, the pair moved slightly upwards and is now trading at 1.1143. This price is slightly below the 14-day and 21-day E.M.As. The moving average of oscillator also moved slightly higher while the RSI is slightly higher than the oversold level. The pair will likely resume the downward trend today.
EUR/GBP
The EUR/GBP pair is trading at 0.9244, which is slightly above yesterday’s low of 0.9227. Still, the pair is below the weekly high of 0.9323, which is the highest level in years. On the four-hour chart, the price is slightly above the lower line of the Bollinger Bands while the 14-day and 28-day moving averages appear to be making a crossover. The RSI has been declining too. The pair could continue moving lower, to test the important support of 0.9200.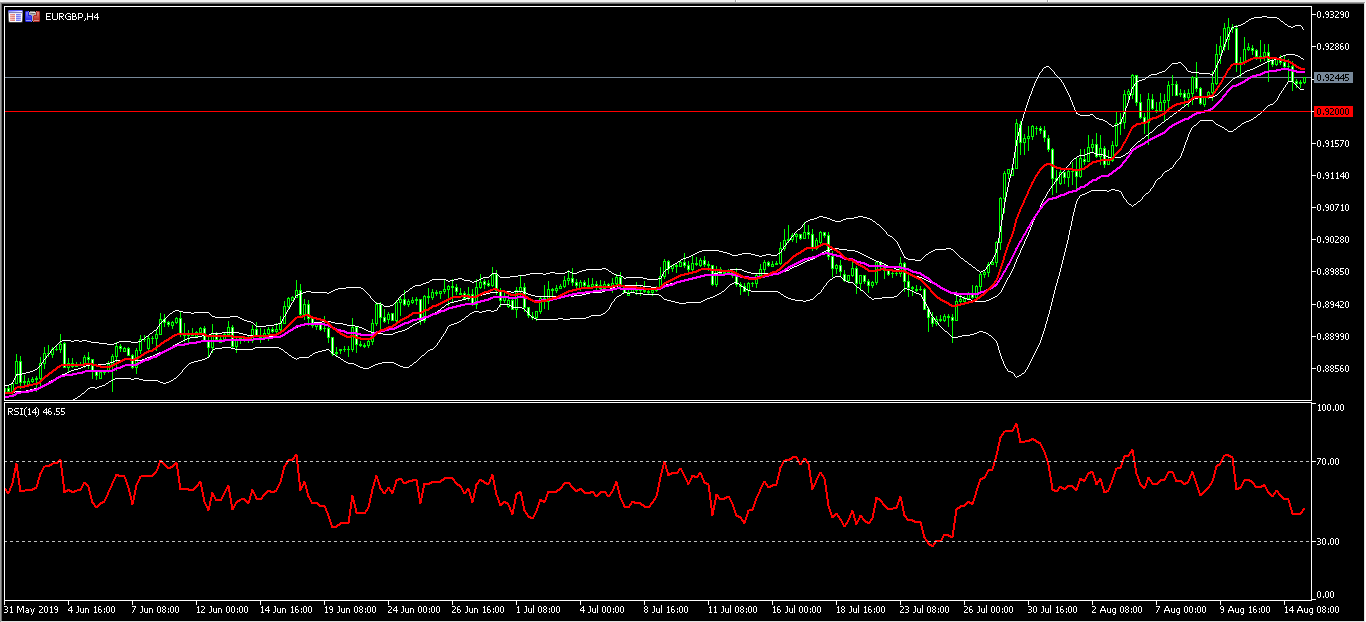
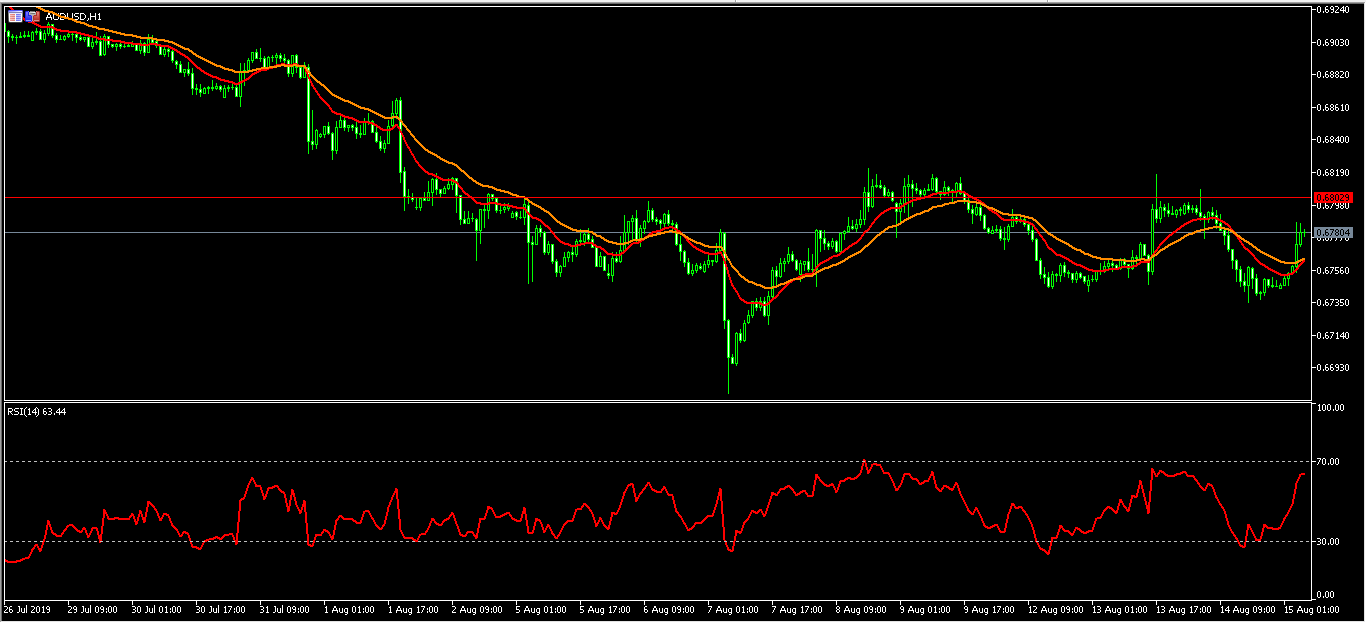
AUD/USD
The AUD/USD pair rose sharply in the Australian trading session. The pair reached a high of 0.6787. On the hourly chart, the price is slightly above the 14-day and 28-day moving averages. The RSI has moved up slightly to the current level of 63. Today, the pair will likely test the important resistance level of 0.6800.