
China shares outperform
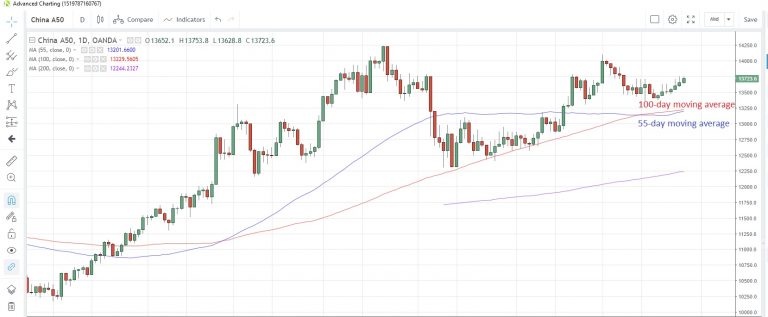
Asia shrugged off the weaker close on Wall Street and extended the recent bullish run with gains of between 0.20% and 0.45% for US indices, though none managed enough gains to reach fresh record highs, as we await Q2 GDP data for the US. China shares jumped 0.51%, extending gains to a fourth consecutive day and hitting the highest level in nearly three weeks as face-to-face trade negotiations between the US and China are due to restart early next week.
The 55-day moving average at 13,201 has turned positive this week and looks set to cross back above the 100-day moving average at 13,229 early next week.
ChinaA50 Daily Chart
Risk appetite not reflected in currencies
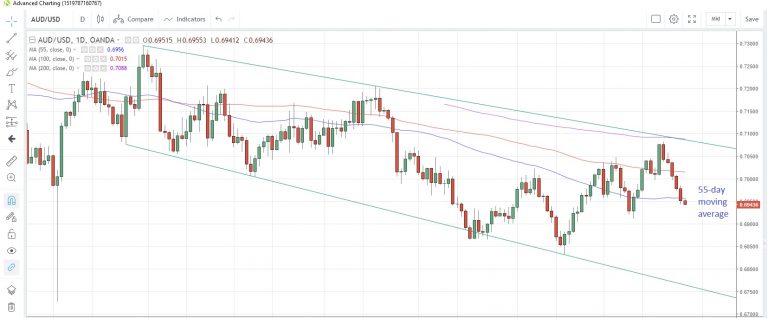
The broader positive risk appetite was not apparent in currency markets, with the beta-risk Australian dollar trading negatively on the day. AUD/USD fell 0.12% to 0.6943 while AUD/JPY also slid 0.12% to 75.41. AUD/USD has now fallen for six straight days, the longest losing streak since January/February 2018. The FX pair opened below the 55-day moving average at 0.6956 for the first time since July 10.
AUD/USD Daily Chart
Euro settling mid-range
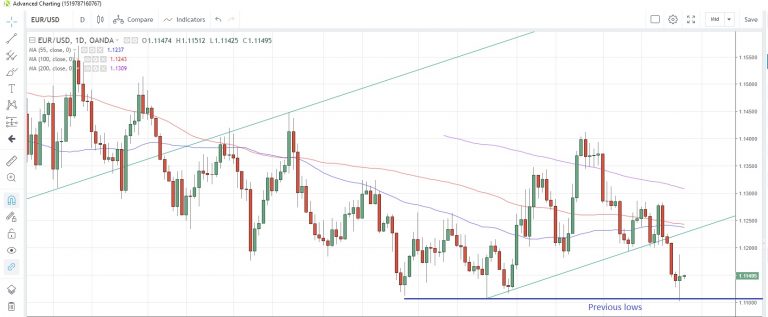
Following its wild gyrations yesterday, EUR/USD seems to have found its level this morning near the middle of yesterday’s 1.1101 to 1.1188 range. For yesterday to be confirmed as a bullish outside-range day on the charts, we would need a higher close today. The FX pair is now at 1.1149 with the 55-day and 100-day moving averages lurking above at 1.1237 and 1.1243, respectively.
As my London colleague, Craig Erlam, mentioned here, the fact that cutting rates was not discussed yesterday does not mean it will not be at future meetings. Indeed, in Draghi’s press conference yesterday he said that he sees rate at current, or even lower, levels at least through the first half of 202, or as long as necessary. As a result, any upmove in EUR/USD is likely to be correctional in nature within the broader downtrend.
EUR/USD Daily Chart
US growth to slow
The main event on today’s data calendar will undoubtedly be US GDP growth numbers for the second quarter. Estimates suggest growth slowed to 1.8% annualized from 3.1% in Q1, which would be the slowest rate of expansion since the first quarter of 2016. No doubt US President Trump will blame the Fed for the lascklustre performance due to their hiking cycle last year.
Aside from the GDP data, the personal consumption expenditure – prices index is expected to tick higher to +0.6% q/q from +0.5% in Q1.