Week beginning 25 June 2018
- Global risks to the fore, but opportunity lingers on the horizon.
- Australia: private sector credit.
- NZ: RBNZ policy decision, business confidence, building consents.
- China: National PMIs.
- Europe: EU Summit, CPI, business surveys.
- US: PCE inflation, personal income & spending.
- Key economic & financial forecasts.
Information contained in this report current as at 22 June 2018.
Global Growth Risks to the Fore, But Opportunity Lingers on the Horizon
Australia has been enjoying a tailwind from above average global growth. Commodity prices have boosted national income, providing a windfall for government budgets, and external demand for our services is unprecedented.
Yet of late, otherwise clear skies have become shrouded by concerns that our growth trajectory may become somewhat more bumpy. Trade tariffs and geopolitical drama dominate the headlines, but China’s debt also looms in the shadows and, of late, emerging market risks have also increased.
Rising US yields and a bounce in the USD has seen a partial unwind of yesteryear’s carry trade – borrowing cheaply in the US to invest in higher yielding emerging markets. Though the emerging market sell off has been most intense outside Asia, important regional trading partners of Australia and China have also been affected. Given the increase in uncertainty, what does the outlook hold?
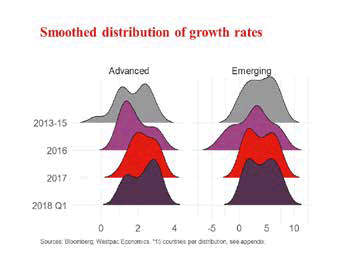
The first thing to note is that the pace of global growth already looks to be cresting. The chart below shows the smoothed distribution of growth in thirty advanced and emerging economies.
The synchronised pick up in global growth during 2017 in both regions is clear. However, in Q1 2018, the advanced economies distribution has become increasingly bi-modal. This reflects the slowdown in Europe, Japan and South Korea from well above trend growth last year. The first quarter was hampered by adverse weather effects, but leading indicators are not signalling a rebound come Q2. In contrast, the US is looking to pick up speed, spurred on by fiscal stimulus, job growth and confidence.
Compare the above situation to emerging economies, where the distribution looks remarkably unchanged – albeit similarly split. It is notable that some of the Asian economies that have been affected by the emerging markets sell off have been posting solid economic data. For example, India’s Q1 GDP growth beat estimates, being 7.7% higher over the year to March, and 6.7% for financial year 2016–17 as a whole. Indonesia’s manufacturing PMI also lifted to a 23-month high of 51.7 in May, with firms reporting robust domestic demand.
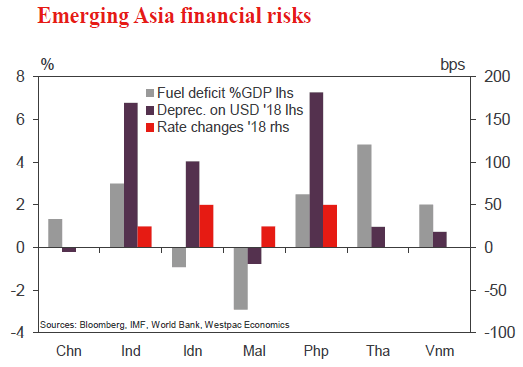
To focus solely on the latest prints is to ignore that market pricing is forward looking. Yet it implies that the rush to sell is more reflexive than driven by a real economy shock. Ahead, the feedback from financial markets to the real economy is, of course, an important dynamic which needs to be monitored. When you combine depreciating currencies, higher commodity prices and higher domestic rates, risks clearly become elevated. The next chart looks at the fuel trade deficit; depreciation against the USD in 2018; and changes in benchmark rates in 2018 for China; India; Indonesia; Malaysia; the Philippines; Thailand; and Vietnam. Excluding China, these six nations account for 13% of Australia’s exports and 14% of our imports.
Three countries’ currencies have been hit hard by the sell off: India; Indonesia; and the Philippines. They all run current account deficits meaning they are net borrowers in global capital markets. The weaker currency boosts inflation rates and often also triggers the central bank to tighten policy, squeezing real household incomes. Notably, India raised rates by 25bps in June on inflation concerns, and Indonesia hiked by 50bps in May to defend the currency. The Philippines hiked by 25bps recently after a previous 25bps hike earlier in the year and Malaysia also previously hiked by 25bps.
Fuel’s share of household consumption and some countries’ net importer status means the 30% rise in Brent crude prices since Q3 2017 has great significance not only for inflation, but also activity. A growth slowdown would (if it eventuated) come at an awkward time for many governments, with elections in India, Indonesia and Thailand scheduled to take place in the first half of 2019.
Real economy stress stemming from financial markets could lead to a backlash against greater global integration, as was the case following the Asian Financial Crisis.
That said, it is important to acknowledge that much of the increased integration in this decade differs to the marketsbased investment of the 1990s. China’s Belt and Road initiative and the parallel India/Japan-led Asia-Africa Growth corridor are strategic initiatives driven by state funding. As such, their commitment to investment is not subject to the same temperamental flows. However, politically it faces more challenges. In regards to Belt and Road, a facilitating catalyst may be upon us in this election cycle.
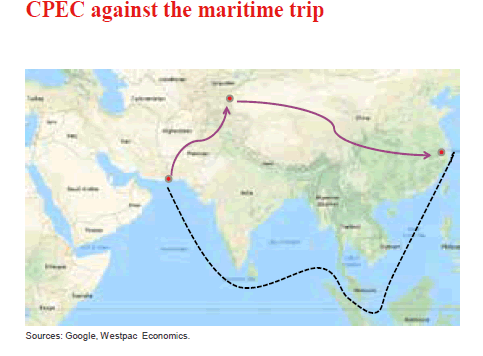
The Pakistan general election will be held on July 25, 2018. The last election was held in May 2013 and garnered minimal international attention. That was prior to the announcement of Belt and Road and the China–Pakistan Economic Corridor (CPEC). The hallmark of CPEC is Gwadar Port which, in late 2015, was leased to China until 2059. The deep sea port is located just outside the Strait of Hormuz, linking Asia to the Middle East. It will give China an alternative to the current shipping route through the narrow Strait of Malacca in Malaysia. That journey is around 10,000km long. The distance from Gwadar to Kashgar (Xinjiang) in Western China is instead around 2,500 km, then another 4,500km to the East.
The port has faced difficulties with Gwadar locals, and there have been reports of government corruption. However, the election could mark the beginning of acceleration in CPEC. As the incumbent Prime Minister Nawaz Sharif has been disqualified from running due to allegations of corruption, the PTI opposition party has gained popularity. The key here is the opposition party’s critical nature towards the US. Their increased political clout could see a further pivot towards closer relations with China, giving additional impetus to Belt and Road. Should that lead to successful development of a path through Pakistan, the potential for Asian growth and further expansion of Western China could be facilitated sooner.
As such, while recognising the aforementioned near-term difficulties for Asian markets, we should not lose sight of the longer run possibility of another Asia growth miracle, this time precipitated by the success of China’s Belt and Road rather than the earlier bottom-up driven trade-led boom of Japan, the East Asian Tigers and China. A comparison of China’s current links with South East Asian countries offers an indicative blueprint of what can be achieved.
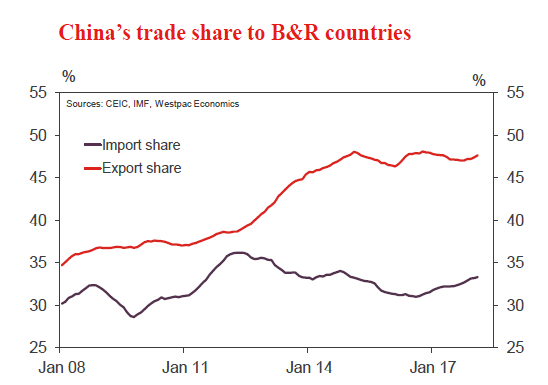
Firstly, the chart below shows China’s trade with Belt and Road countries as a proportion of total Chinese trade.
There are 63 Belt and Road countries across Europe, the Middle East, North Africa and Central, South and South East Asia We can see that China’s imports from these countries have been flat, partly due to the 2014 decline in oil prices. The proportional outperformance of the export share happened before 2015, the year when the Belt and Road Initiative was shaped.
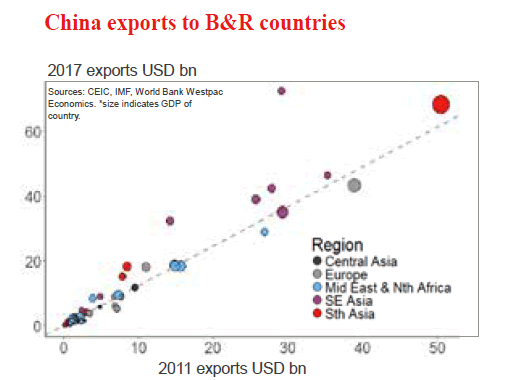
The next chart gives a reasonable explanation as to why this is the case. It shows China’s 2011 exports to a given country on the x axis and the corresponding 2017 exports on the y axis. The grey line indicates China’s overall export growth over the period (3.4% CAGR). A point above the grey line indicates exports to the country grew faster than overall exports.
Note that the points are also colour coded by region and that the size indicates the country’s GDP. It is clear that the cluster of outperformers are in the South East Asian region. Most notable is Vietnam which more than doubled its imports from China over the period, while the only underperformer was exports to Indonesia. Geography is clearly critical. The Belt and Road will not bring any of these countries closer to China on the map, but improved infrastructure and reduced trade barriers will effectively achieve the same thing.
Other detail on the chart suggests we have reason to be optimistic. To the left, we can see two South Asia outperformers: Pakistan and Bangladesh. Trade here also doubled, albeit from a much lower base. As said, further integration with Pakistan is key to a great part of this initiative. Bangladesh too is important to the overall strategy, given its close relationship with India.
In that regard, the most notable feature on the above chart is the large red point to the right representing India. Even though India is critical of Belt and Road, and has boycotted meetings, exports from China to India have grown considerably.
While India has justifiable concerns over Belt and Road given its political weight, its reaction to the initiative has generally been productive and pragmatic. While welcoming trade with China, the competitive pressure of the Belt and Road initiative has also encouraged India to seek tighter relationships with their neighbours. For example, its response to the Gwadar port is the planned development of Chabahar port in Iran, around 100km further along the coast. The port is part of an India–Iran– Afghanistan partnership providing access towards Europe.
Multilateral cooperation is strikingly positive in Asia. As some major developed economies push back against international trade, the developing world is embracing it. Yes emerging markets are currently out of favour as tighter global monetary policy presents near-term challenges; but beyond that, significant opportunity awaits. The Sun rose first, the Tigers followed and the ascending Dragon is looking over its shoulder to its west.
The week that was
The past week has again seen a focus on monetary policy, with central bank authorities from across the world meeting at the ECB’s Forum on Central Banking.
Before we turn to this global perspective on policy, we should start at home with the minutes of the June RBA meeting. Broadly this communication was consistent with prior statements from the RBA, though it omitted a reference to the next move in rates likely being up – last seen in the Governor’s 13 June speech, and before that the minutes from the April and May meetings. This is most likely a timely tactical decision, to save it from becoming an unwanted focus at a later stage.
The key sentence in this set of minutes regarding the considerations for monetary policy was instead: “Further progress in the period ahead in reducing unemployment and returning inflation to the target was therefore expected, although this progress was likely to be gradual”. The implication is that, while still the RBA’s base case, a rate hike is a long way off and conditional on global risks not crystallising. On the domestic front, the consumer is the central risk to the RBA’s view. To put it simply, if wage inflation is to strengthen, the recent downturn in employment growth has to prove temporary. Further, the RBA needs declining house prices and a possible “further tightening of lending standards in the period ahead” to not affect consumption.
We continue to believe that activity growth will slow below trend through 2018 and 2019; wage and consumer inflation will remain nearer 2%yr than 3%yr; and that the RBA will therefore remain on hold through the end of 2019.
Turning to the global policy view provided by the ECB’s Sintra Conference. For those interested, many of the presentations were recorded and can be accessed online. For our purposes however, it is sufficient to focus on the panel discussion that included the RBA Governor along with the head of the FOMC; ECB and BOJ.
Consistent with recent communications from each institution: US FOMC Chair Jerome Powell was fervently positive without being anxious over inflation prospects; while ECB President Draghi was hopeful, thanks to progress on wage and consumer inflation, but clear that there is more work to be done before the economy can stand by itself. For policy and markets, the consequence is that the US will continue to see a gradual increase in the fed funds rate (and market interest rates) over the coming year; however in Europe, rates will remain static.
From our own Governor Lowe, the focus was on the welfare of the people. In his remarks, there was recognition that, while Australia didn’t suffer a recession post-GFC, it is still experiencing disappointing wage and productivity growth, and consequently below-target inflation. Wage headwinds from globalisation; cost control; and higher participation by older workers (greater labour supply) are expected to persist for some time, restraining inflation. The Governor’s take home point in response was that, to his mind, it is better to accept missing the inflation target for a time rather than stoking inflation via higher credit growth and (potentially) an increase in financial risks. This implies that the RBA will be patient with policy in both directions: only increasing the cash rate if employment growth bears fruit for wages and inflation; while also holding back from cutting rates, unless the labour market suffers a sustained deterioration. Financial stability is key and will remain so.
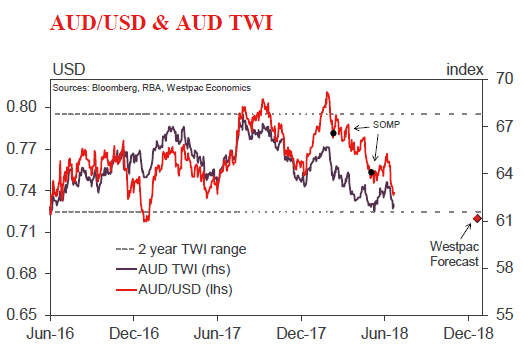
Finally, trade frictions continue to rumble on. The effect on confidence has been most obvious in foreign exchange markets with, for example, the Australian dollar trading down through the USD0.74 figure this week, having previously shown stability around USD0.75. The state of play between the US and China is as follows. The US will impose tariffs on $34bn of specified imports from China come 6 July, and an additional $16bn of trade once the products are confirmed. China will respond with tariffs on $34bn of US imports, again from 6 July, and a further $16bn of imports if the US proceeds with the tariffs still under negotiation. What created the market shock was arguably President Trump’s subsequent request to the United States Trade Representative to find a further $200bn of Chinese imports to the US to levy tariffs on if China goes ahead with its stated response, as well as an additional $200bn if they go further. To our core view for the Australian dollar, these market ructions are a clear (and likely lasting) downside risk. It is however important to remember that the strategic initiatives underway in Asia, Belt and Road in China as an example, still offer enduring hope of greater and fairer trade for the world.
Chart of the week: the Australian Dollar
The decline in the Australian dollar has provided some reprieve from tightening financial conditions centred on a higher BBSW, higher term rates and a modest increase in credit spreads.
Following a decisive shift down from USD0.78, during April-May, the Australian dollar has now broken through the USD0.75 level, then 0.74, before retracing to hold back around the figure.
The question to ask is whether the current level is evidence of a low, or if it is instead merely a pause for breath in a longer downtrend. We continue to argue the latter, believing that the Australian dollar will inevitably lose altitude to USD0.72 by March 2019, and thereafter test USD0.70 in the second half of 2019. This view comes as a consequence of our expectations for the US and commodity prices.
New Zealand: week ahead & data wrap
Taking stock
This week’s GDP figures provided more evidence that the New Zealand economy has lost some momentum. We have long been expecting a period of subdued growth, reflecting businesses’ uncertainty about the new Government and a cooling in the housing market. Increased government spending will provide a boost to activity in coming years, but the pace of economic growth appears to be well past its peak.
GDP rose by 0.5% in the March quarter, following gains of 0.6% in each of the previous two quarters. Some minor revisions to history saw the annual growth rate nudge down to 2.7%, a little below market expectations.
There was little in the way of special factors that might have held down the quarterly result – growth was widespread across industries, but was unremarkable in most cases. Household spending was flat as consumers turned more cautious, and construction activity slowed in the face of capacity and finance constraints. Dairy production picked up a little after a poor start to the season.
Of course, GDP is a somewhat dated measure of how the economy is tracking; it’s almost three months since the end of the March quarter. This week, we review recent data to assess how the economy has performed since then. There is not a lot of support for the idea that growth has re-accelerated in the June quarter – in fact, our forecast of a 0.7% rise in GDP may be on the high side.
Housing: house price inflation has slowed again in the last few months, with Auckland prices falling slightly. The new Government’s array of policies aimed at dampening housing speculation appear to be having some bite. The ‘bright-line’ test for capital gains on investment properties has been extended from two to five years, restrictions on foreign buyers will soon come into force, and negative gearing will start to be phased out next year.
We are forecasting house prices to be essentially flat over the next few years. However, the extent of the housing slowdown will depend on how some of these policies are specified, which is still up in the air to some degree.
Notably, the bill for restricting foreign buyers has been softened from the initial proposal. Under certain conditions, foreign buyers will no longer be forced to on-sell completed apartments that they had purchased off the plan. The property transfer statistics suggest that foreign buyers are already concentrated in the apartment space (they account for a much higher share of sales in central Auckland and Queenstown). So this could make the policy significantly less binding than we had assumed.
Consumer: property prices have a major influence on household’s willingness to spend, and retail spending growth cooled in the March quarter as the housing market has slowed. The latest electronic card spending figures indicate that consumers remain cautious: card spending fell sharply in April, and picked up only modestly in May.
On the positive side, vehicle sales are shaping up better for the latest quarter. Sales were hampered in the March quarter as some import shipments were delayed due to the discovery of marmorated stink bugs. The car registration figures up to May suggest that this backlog is now being cleared. That said, registrations are still down from last year’s peaks.
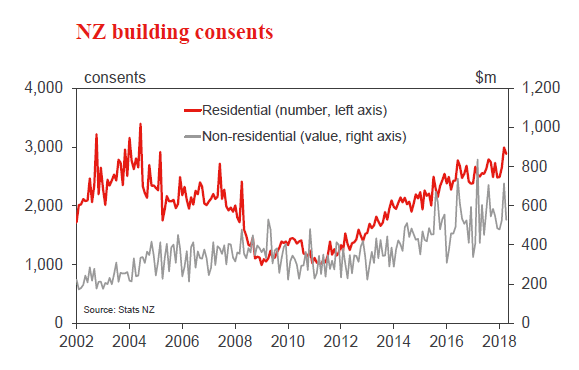
Construction: capacity constraints and access to finance continue to present a challenge for the building industry. However, building consents have remained strong in recent months, and have been particularly strong for multiples (apartments and townhouses) in Auckland, which is precisely where the growth is most needed. We expect a lift in building activity over the rest of this year, but at a gradual pace.
Domestic activity: the monthly Business NZ surveys have shown mixed results. The manufacturing PMI has been on the soft side in recent months, apart from a brief spike in April. However, the services PSI activity has improved over the last few months, having slowed down in late 2017 and early 2018.
Labour: high-frequency information on the labour market is hard to come by, but we note that up to May the growth in job advertisements has continued to slow. While the labour market has tightened, it is not obvious that a shortage of skilled workers would deter employers from looking; the slowdown in ads is more suggestive of a softening in demand.
Trade: export volumes fell sharply in the March quarter, which we put down to a combination of weak milk production in the first part of the season and the timing of export shipments. Both of these factors point to healthier export volumes in the June quarter. Export commodity prices have also improved in the last few months, both in world price terms and after accounting for the lower New Zealand dollar. Tourist numbers are still trending higher, but the pace of growth has slowed.
Overall, the June quarter is shaping up to be another period of modest growth at best. That stands in contrast to the view of the Reserve Bank, which has long held bullish expectations for growth in 2018. The soft March quarter result – the sixth consecutive quarter in which GDP growth has fallen short of the RBNZ’s forecast – will provide food for thought for next Thursday’s OCR review.
However, there have also been some inflation-positive developments since the last OCR decision in May. The 2018 Budget was stimulatory, with Government spending now expected to have an even larger impact on aggregate demand in the early 2020s than the RBNZ previously allowed for. And a sharp rise in fuel prices means that inflation is likely to rise back to 2% much sooner than the RBNZ expected (though this rise may not be sustained into next year). While the balance of risks to inflation has probably tilted higher, we expect the RBNZ to maintain its basic message that the OCR will be on hold for an extended period.
Data Previews
Aus May private credit
- Jun 29, Last: 0.4%, WBC f/c: 0.3%
- Mkt f/c: 0.4%, Range: 0.3% to 0.6%
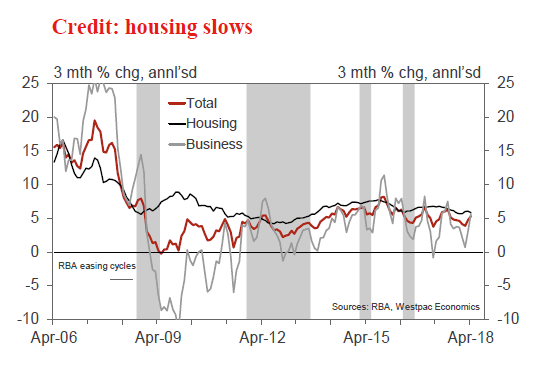
Private sector credit is expanding at a modest pace as the housing sector cools. In 2017, credit grew by 4.8%, slowing from 5.6% for 2016. For the month of May, we expect a subdued rise of 0.3%, one notch down from the recent average of 0.4%.
Housing credit, at this late stage of the cycle, is slowing as tighter lending conditions see new lending decline. In April, housing credit grew by 0.43%mth, 6.0%yr, with the 3 month annualised pace at 5.8%, down from 6.8% a year earlier.
Business credit, 4.3% above the level of a year ago, is volatile around a modest uptrend as businesses increase investment in the real economy. The past two months were above par results (0.7% and 0.5%) as the segment emerged from a soft spot at the turn of the year. The risk is a more modest gain is recorded in May.
Personal credit continues to contract, -1.2% over the year.
NZ June ANZ business confidence
- Jun 27, Last: -27.2
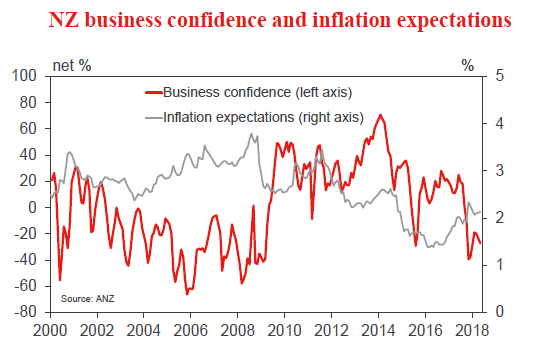
Business confidence has fallen over the last couple of months. The fall in confidence has been fairly wide spread with the construction sector particularly pessimistic in recent months.
It will be interesting to see how confidence in the agricultural sector has responded to the Government’s decision to attempt to eradicate Mycoplasma bovis. • We expect soft confidence to translate to a lull in business investment this year.
Inflation expectations have been relatively stable in recent months. They may edge higher over the second half of the year on the back of rising petrol prices and rising headline CPI inflation.
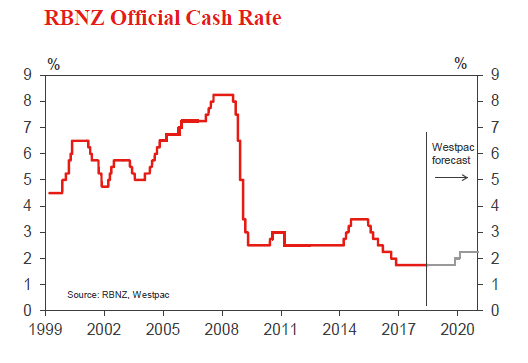
RBNZ OCR Review
- Jun 28, Last 1.75%, Westpac 1.75%, Market 1.75%
We expect the RBNZ to repeat its main message that the OCR is likely to remain on hold for a long while, but that the timing and direction of the next move will depend on how the economy evolves.
Focus on whether the RBNZ repeats the words “up or down” in its policy guidance is a red herring. The RBNZ is keen to avoid formulaic communications. They may well choose different words but this would not necessarily constitute a signal that the OCR outlook has changed.
Beneath the policy guidance paragraph, the details of the press release might be slightly more hawkish than the May statement.
NZ May building consents
- Jun 29, Last -3.7%, Westpac f/c: -8%
Residential building consents fell only slightly in April. Consents for multiples (apartments, etc) were particularly strong in March, and we had expected a reversal in April. However, they actually remained at relatively firm levels.
The multiple consents category, which now accounts for half of all consents in Auckland, can be lumpy on a month-tomonth basis. With a large number of these consents in the past two months, we expect to see some normalisation in May. That would still leave consent issuance in Auckland at high levels. At the same time, we expect to see a continued gradual moderation in Canterbury and steady levels in other regions. This combination would leave overall consent issuance down by around 8% in May.
Difficulties accessing finance and shortages of skilled labour continue to provide a brake on building activity. Consequently, while building activity remains elevated, we expect it will only rise at a gradual pace.
US May personal income and spending
- Jun 29, personal income, last 0.3%, WBC 0.4%
- Jun 29, personal spending, last 0.4%, WBC 0.5%
- Jun 29, PCE deflator, last 0.2%, WBC 0.2%
Disposable personal income received a boost in Apr, rising 0.4% following respective gains of 0.3% and 0.2% in February and March. However, inflation offset half that gain, restricting real income growth to 0.2% – as in Mar. Slowly but surely nominal wage incomes should lift; growth in investment income should also hold up, relieving pressure on the savings rate, which has trended down to low levels in recent years.
In light of consumers’ improving financial position, in May we look for a 0.5% gain for spending after a positive lead from retail sales and given services should also support.
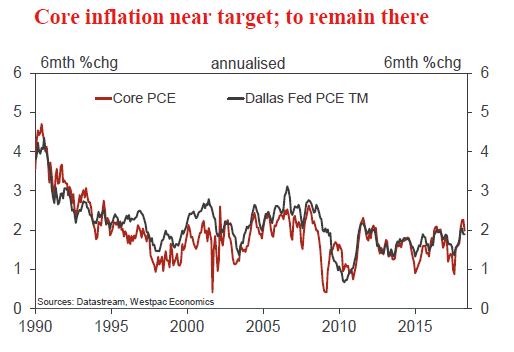
Regarding inflation, on both a headline and core basis, PCE inflation looks set to settle near 2.0%yr. As put forward by the FOMC, risks in either direction are limited.

