Here we go again!
If you’re a regular reader of the blog, you know we’ve been trading the same EUR/GBP support level for what seems like forever now.
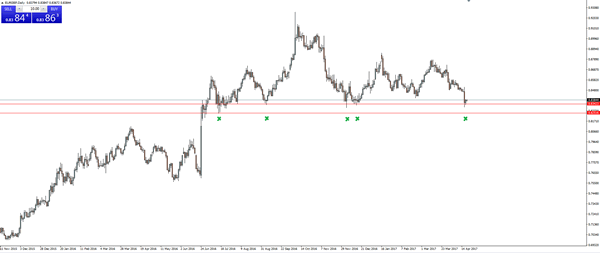
After breaking out of resistance back in June on the back of Brexit, price has continued to use that breakout level, this time as support, as it ranges sideways. Yes, exactly the same as the GBP/USD range that we talked about yesterday.
Now onto the charts:
EUR/GBP Daily:

The daily shows the higher time frame support level that the entire trade idea is based around. So long as the higher time frame support level holds, then we will always be looking for long entries.
EUR/GBP Hourly:

Now zooming into the hourly chart, you get a better feel for price action. In this case, you can see that price has bounced up off the level and come back to retest the short term resistance as support. Textbook technical behaviour for a bullish trending market where price steps up between support/resistance levels.
So now you have both a higher time frame support level as well as a short term bullish trend looking to establish itself. Confirmation!
Where you place your stop from here is up to you and your tolerance for risk. The obvious place is below the higher time frame support level but in putting it all the way down there, you are sacrificing some risk:reward units if the short term level holds and price immediately goes your way.
